Walking and Cycling
At little to no monetary cost, walking and cycling enable large segments of the world’s population – including the poor, the young and the elderly – to independently fulfil their daily transport needs, while improving their personal health and posing little risk to other road users. Walking and cycling are ideal for short journeys, which comprise the majority of all journeys. Walking underpins all other modes of travel by providing “first- and last-mile” access, and walking and cycling have high potential for intermodal access to public transport, making them key to a sustainable modal shift.
Walking and cycling are particularly well-suited transport solutions for addressing the ongoing and interlinked crises of climate change, road deaths, physical inactivity and urban liveability. They have proven to be the most resilient forms of transport and have been integral to mobility responses in the face of natural disasters and health crises, including the COVID-19 pandemic (see Box). However, pedestrians and cyclists remain among the most at risk in road environments, warranting additional investments in safer infrastructure.
Although walking and cycling are both zero-emission, active modes of transport, significant differences exist between them in terms of speed, ability, usage rates, and infrastructure and policy needs. They are often grouped together in policy frameworks at the local, national and global levels, but deserve separate attention with different strategies and interventions.
Key Findings
-
Demand trends
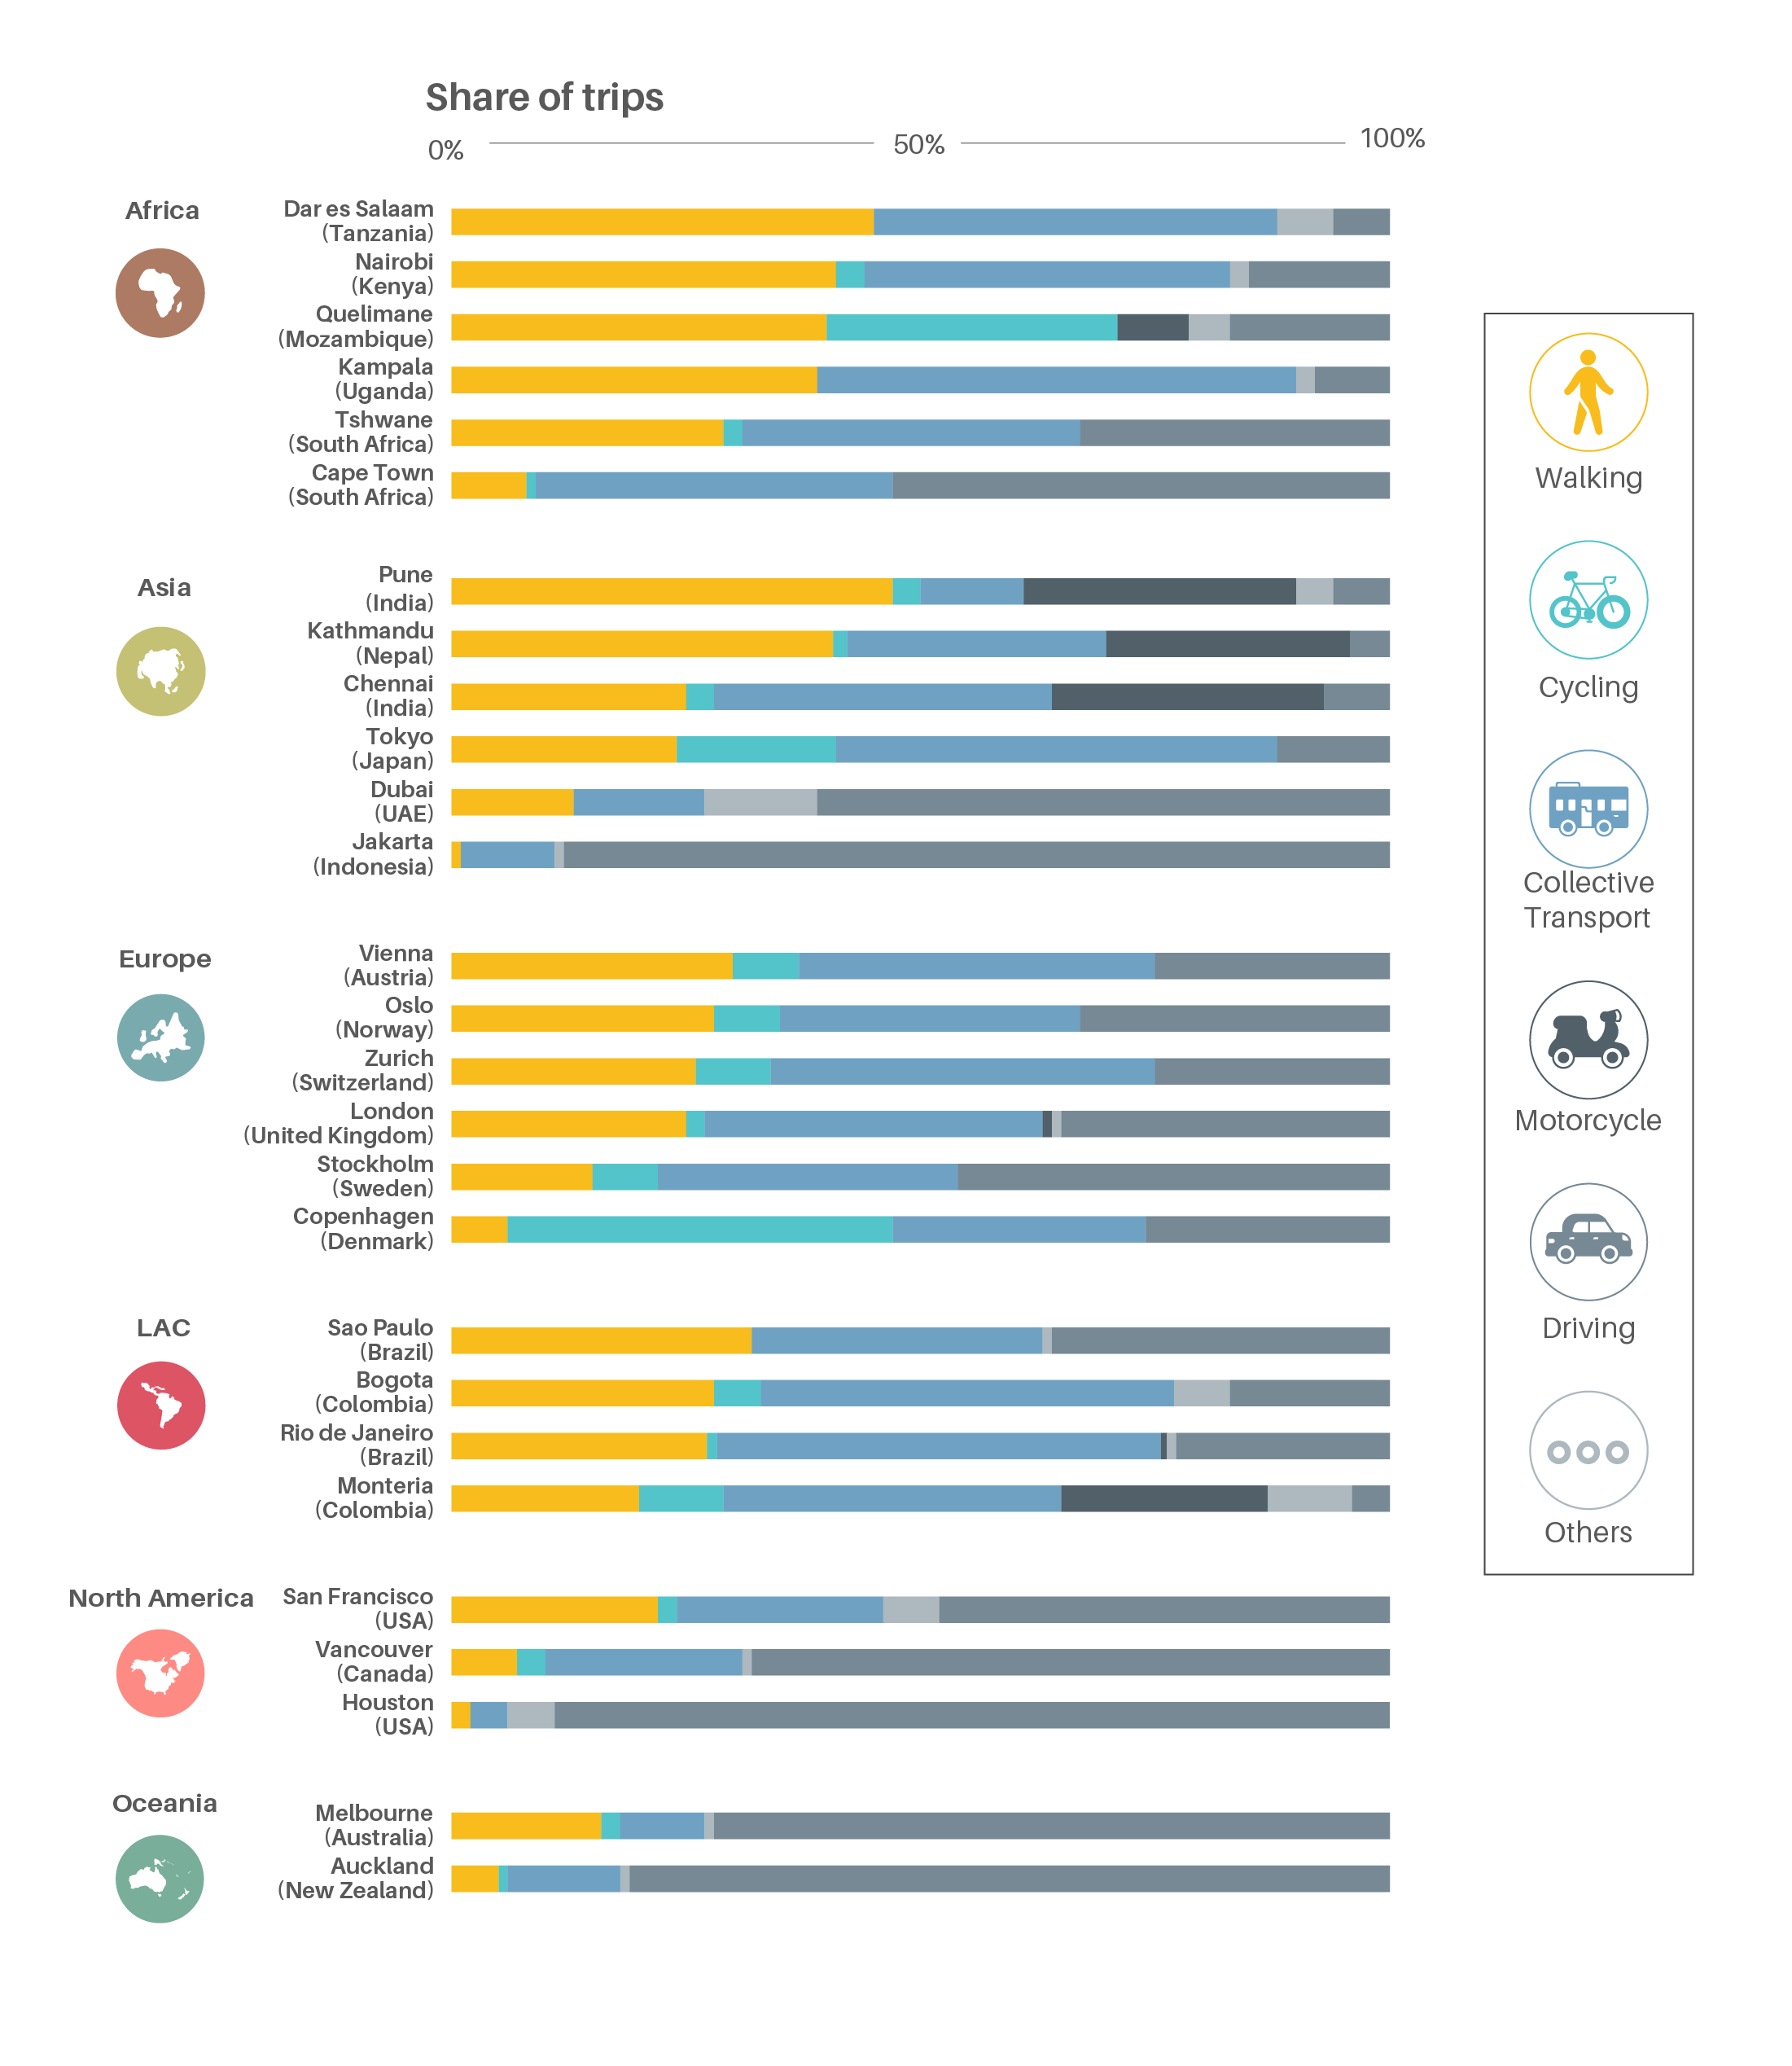
More than one-third of all trips globally are made on foot or by bicycle. Walking is the principal transport mode in most of the Global South, accounting for up to 70% of trips in some cities.
Figure 1.
Share of trips by transport mode in selected cities, various years

Modal shares for walking and cycling have declined in many parts of the world (with some exceptions), driven by rising car ownership, poor infrastructure and unsafe conditions.
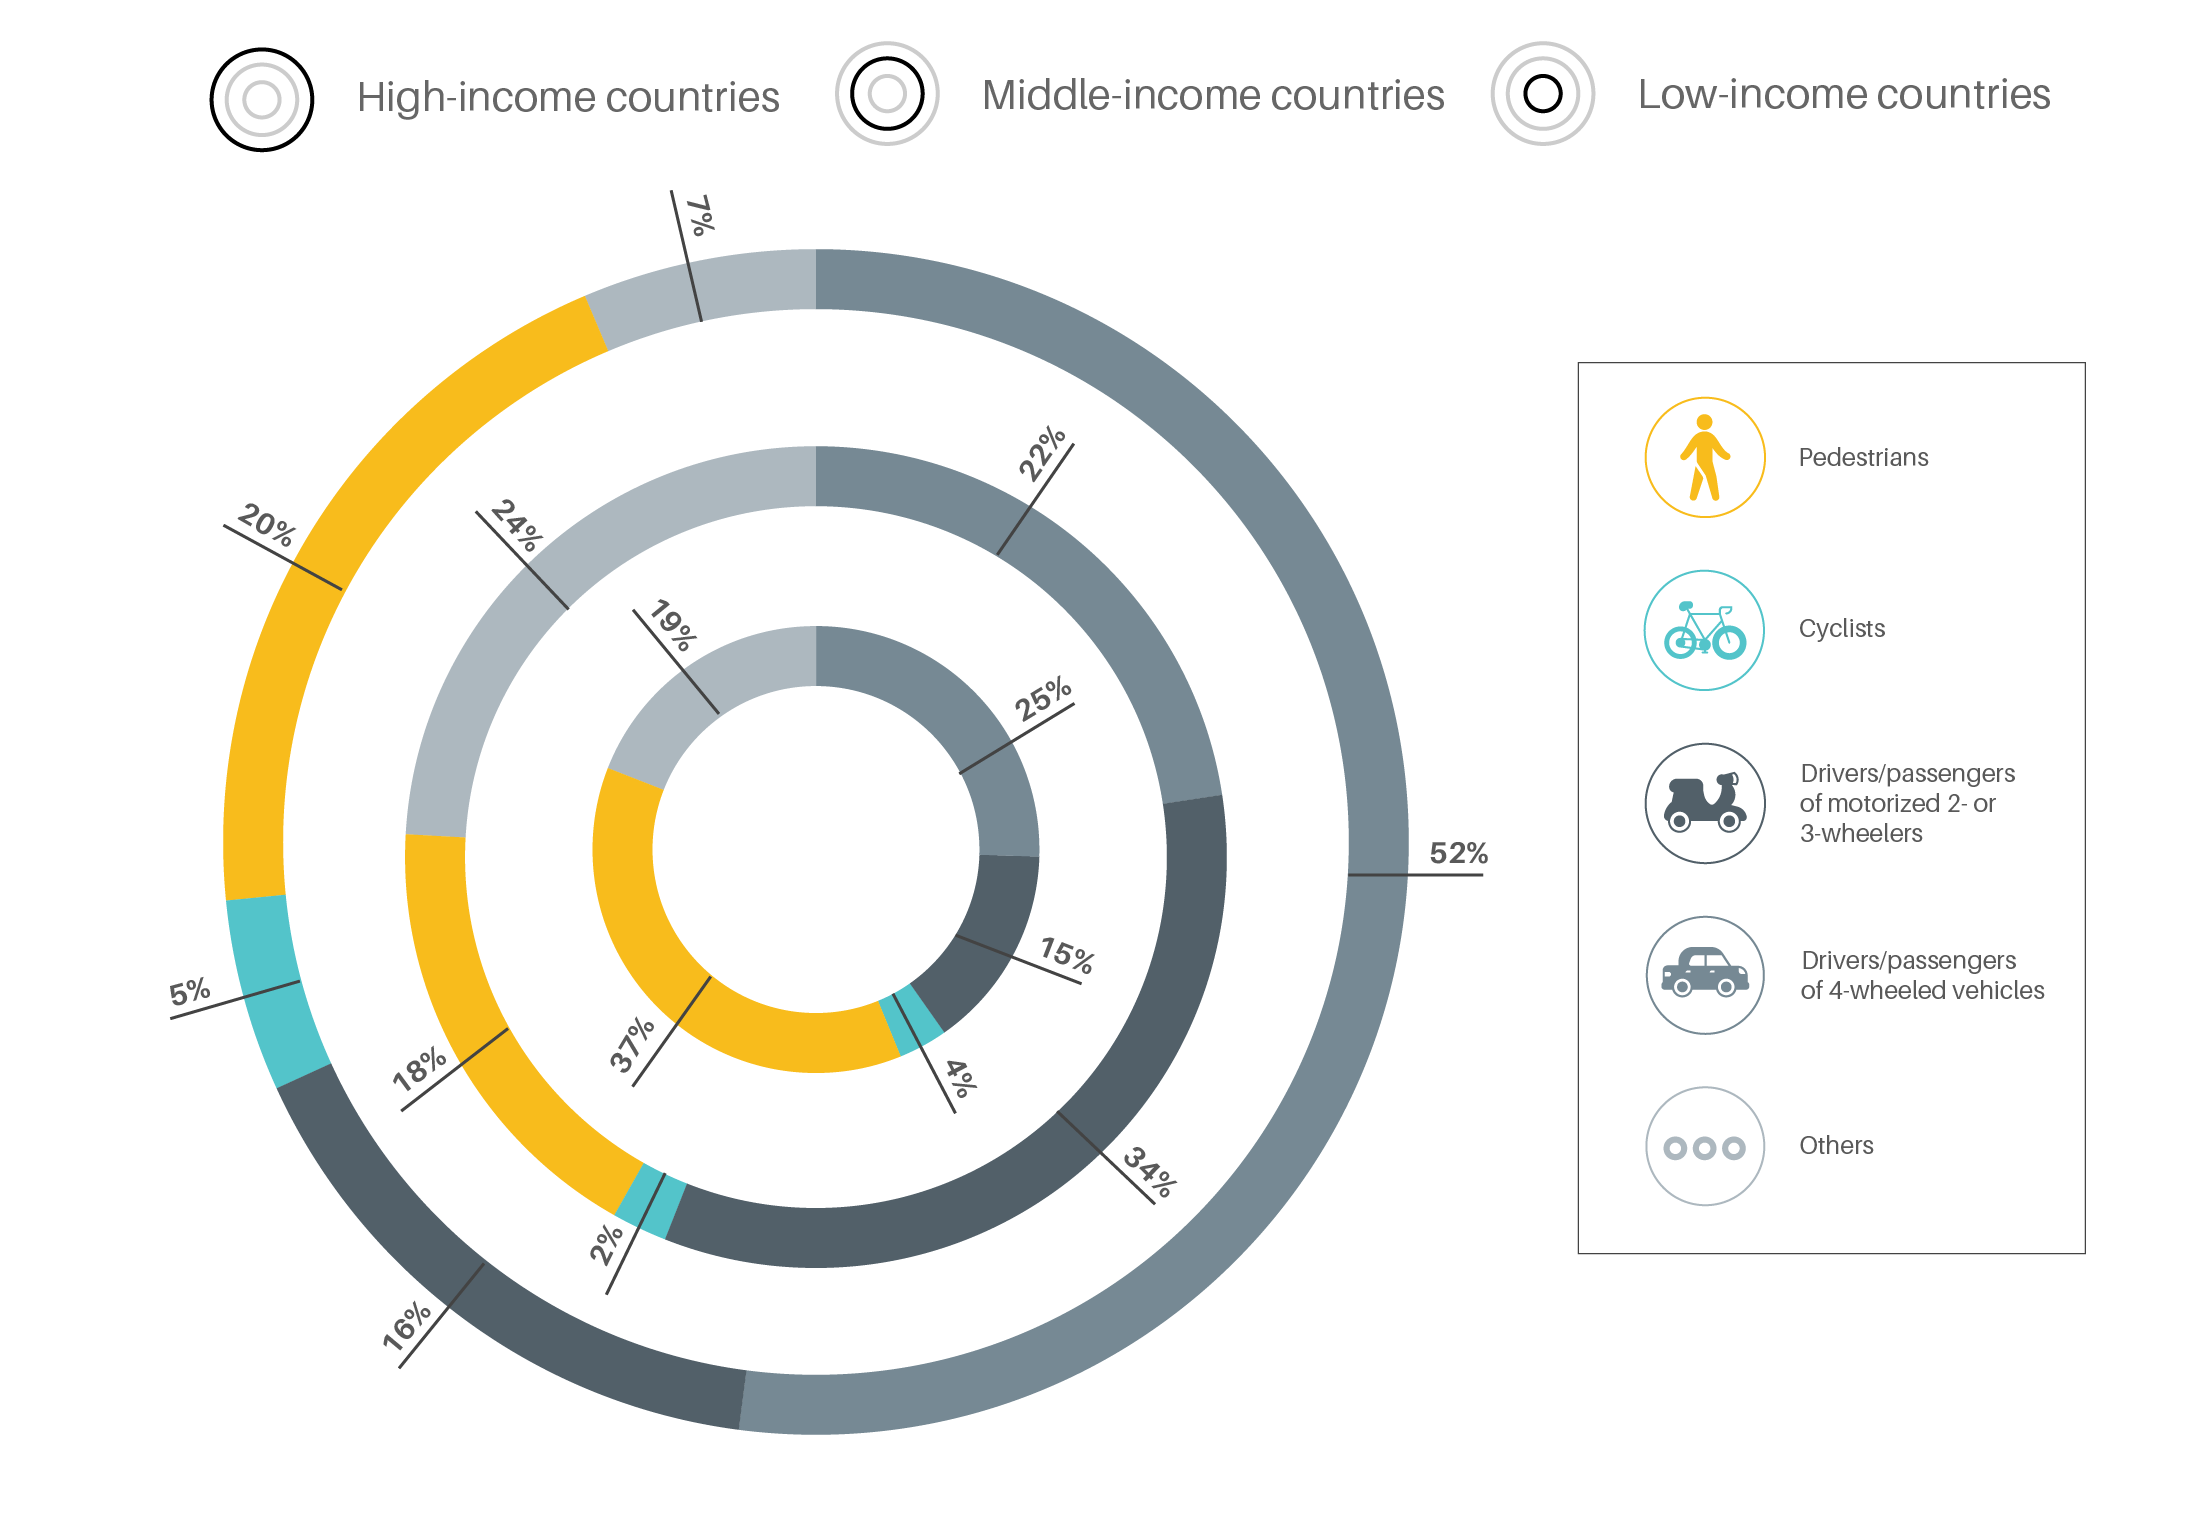
Pedestrians are the main victims of road crashes in low-income countries, where they accounted for more than one-third of fatalities in 2016.
Figure 2.
Road fatalities by group in low-, middle- and high-income countries, 2016

In most areas of the world, male bicycle users greatly outnumber female users, whereas women walk for transport to a greater extent than men, due in part to gender differences in trip patterns.
Cargo bicycles are enjoying a renaissance and recognition for being a cleaner, safer and more efficient means than trucks of transporting people and freight in cities.
-
Emission trends
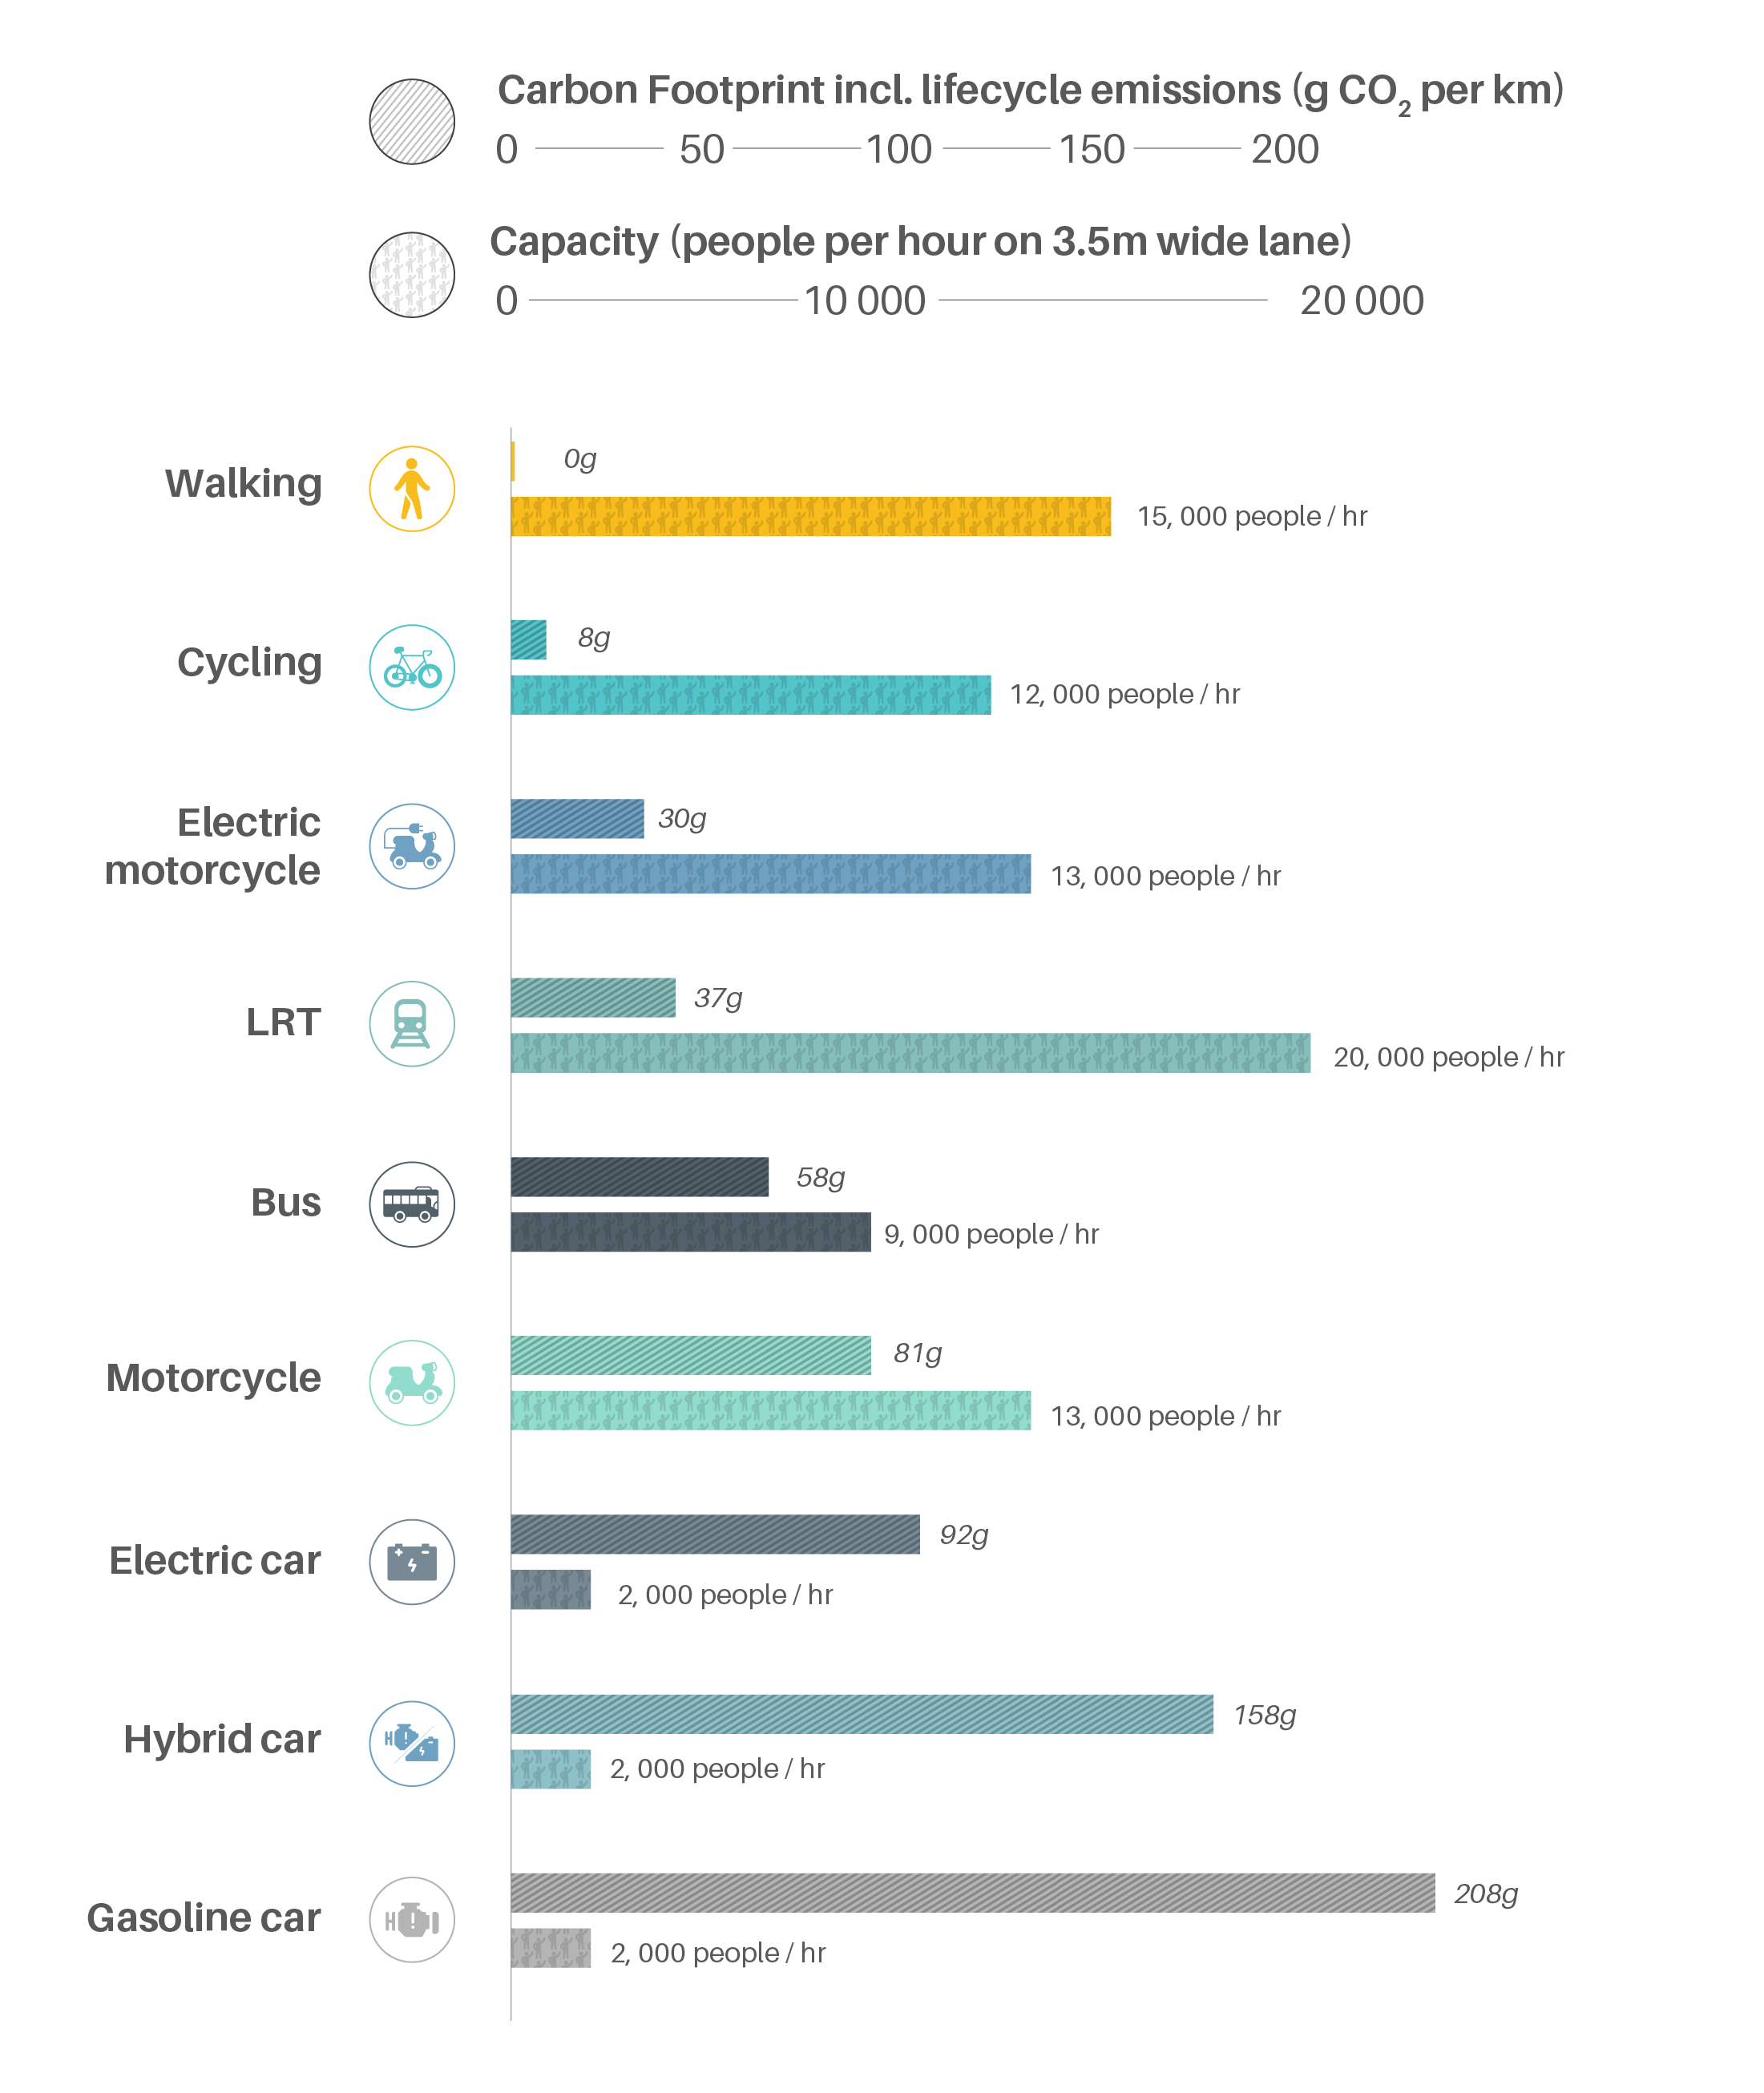
As nearly zero-emission modes of transport, walking and cycling contribute to Paris Agreement targets for reducing transport-related emissions, while moving 6-8 times more people per hour in the same space as automobiles.
Figure 3.
Global capacity and CO2 footprints for different transport modes and vehicles

Walking and cycling are estimated to be feasible substitutes for more than 40% of short car trips; this could save nearly 5% of carbon dioxide (CO2) equivalent emissions from car travel on top of the current estimated 5% of “avoided” emissions from walking and cycling trips.
Recent growth in electric-assisted bicycles (e-bikes) is a positive trend for mobility, but it has a potentially negative impact on transport emissions if e-bikes replace zero-emission modes.
-
Policy Measures
Countries and cities are expanding integrated planning approaches that include walking and cycling as a central element and are setting targets for specified shares of these modes.
Investments in walking and cycling infrastructure have gained momentum worldwide but remain far more limited than investments in traditional roadways.
Many cities have restricted the flow and speed of motorised vehicles to improve the safety of pedestrians and cyclists, with some major cities reporting zero pedestrian and cycling deaths.
An increasing number of global guidelines are specifying technical standards for creating human-scale street infrastructure to improve the safety, comfort and inclusion of all users.
Increasing recognition of the value of walking and cycling has led to their inclusion in recent global policy frameworks, including the WHO Global Action Plan for Physical Activity 2018-2030 and the 2020 Stockholm Declaration on Road Safety.
-
Impacts of the COVID-19 pandemic
During the pandemic, walking and cycling have demonstrated their potential as resilient transport modes with low contagion risks, endorsed by the World Health Organization.
In 2020, more than 194 cities introduced dedicated space for pedestrians or temporary protected bike lanes, many of which are slated to become permanent.
A change in travel preferences caused by the COVID-19 pandemic resulted in increased walking and cycling during the initial phase of the pandemic, which has been sustained in some places.
Key indicators
2017*
2019*
% change
Key indicators
2017*
2019*
% change
Key indicators
2017*
2019*
% change
Key indicators
2017*
2019*
% change
Key indicators
2017*
2019*
% change
Key indicators
2017*
2019*
% change
Key indicators
2017*
2019*
% change
Key indicators
2017*
2019*
% change
Key indicators
2017*
2019*
% change
Key indicators
2017*
2019*
% change
Key indicators
2017*
2019*
% change
(*) Data are for the indicated year unless noted otherwise.
Reliable data on walking and cycling are generally lacking, as the existing data often are not disaggregated, are not counted at all or are grossly undercounted due to an exclusive focus in travel surveys on the principal commuting mode.

