Urban Passenger and Freight Transport
Between 2018 and 2020, global efforts to introduce and increase the quality of urban public transport, such as urban rail and bus rapid transit, resulted in a substantial increase in the share of sustainable transport modes. Urban passenger and freight transport have focused not only on improving collective transport, but also on enhancing its accessibility, integrating different transport modes and improving road safety for other forms of urban transport such as walking and cycling. The intermodality of walking, cycling and public transport plays a major role in establishing efficient, clean and safe urban mobility.
With the majority of the world’s people now living in cities, and this share projected to reach 68% by 2050, low-carbon mobility options for urban dwellers are increasingly needed in order to manage the inherent pressures on transport demand. This includes increased provision and improvement of collective passenger transport services, including public buses and metro systems.
Public transport was hit the hardest (among all transport modes) by the COVID-19 pandemic, with ridership and revenues falling to unprecedented levels. Cities around the world have responded in various ways to ensure the safety and operation of services. Many used the interruptions as a time to accelerate modernisation of payment systems, install temporary bicycle lanes and open up streets. Freight transport, after several years of constant growth in e-commerce, experienced a steep increase in grocery, food and retail deliveries. The demand for last-mile deliveries grew during pandemic-related lockdowns.
Key Findings
-
Demand trends
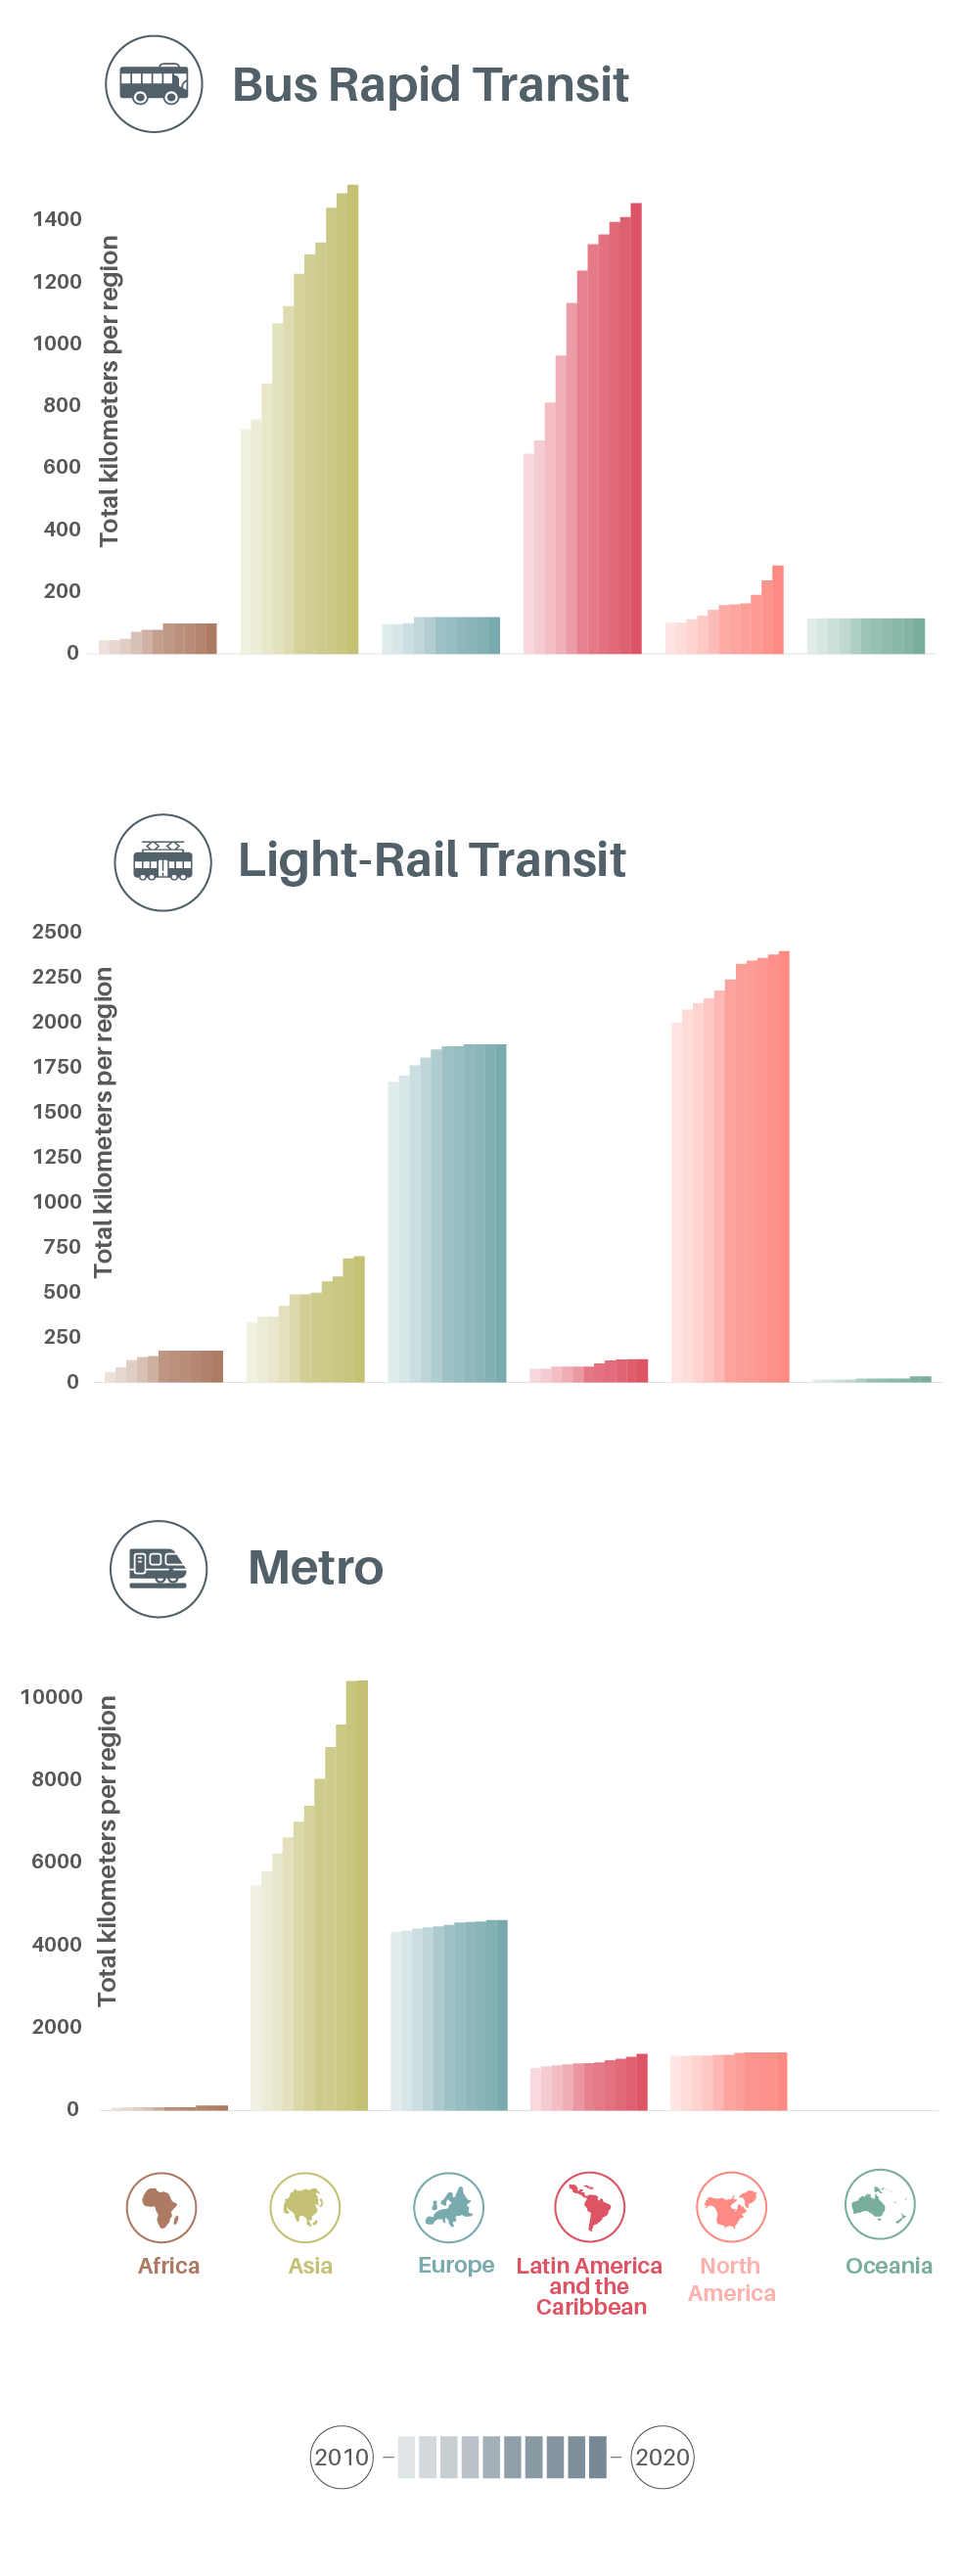
Public transport systems continued to grow between 2010 and 2020, led by strong growth in Asia (for bus rapid transit, light rail and metro) and Latin America (for bus rapid transit). The global rapid transit-to-resident ratio (a measure of these three urban services) increased 5% between 2017 and 2019, with a 25% increase in China and a 13% increase in India.
Figure 1.
Growth in major public transport systems (bus rapid transit, light rail and metro) by region, 2010-2020
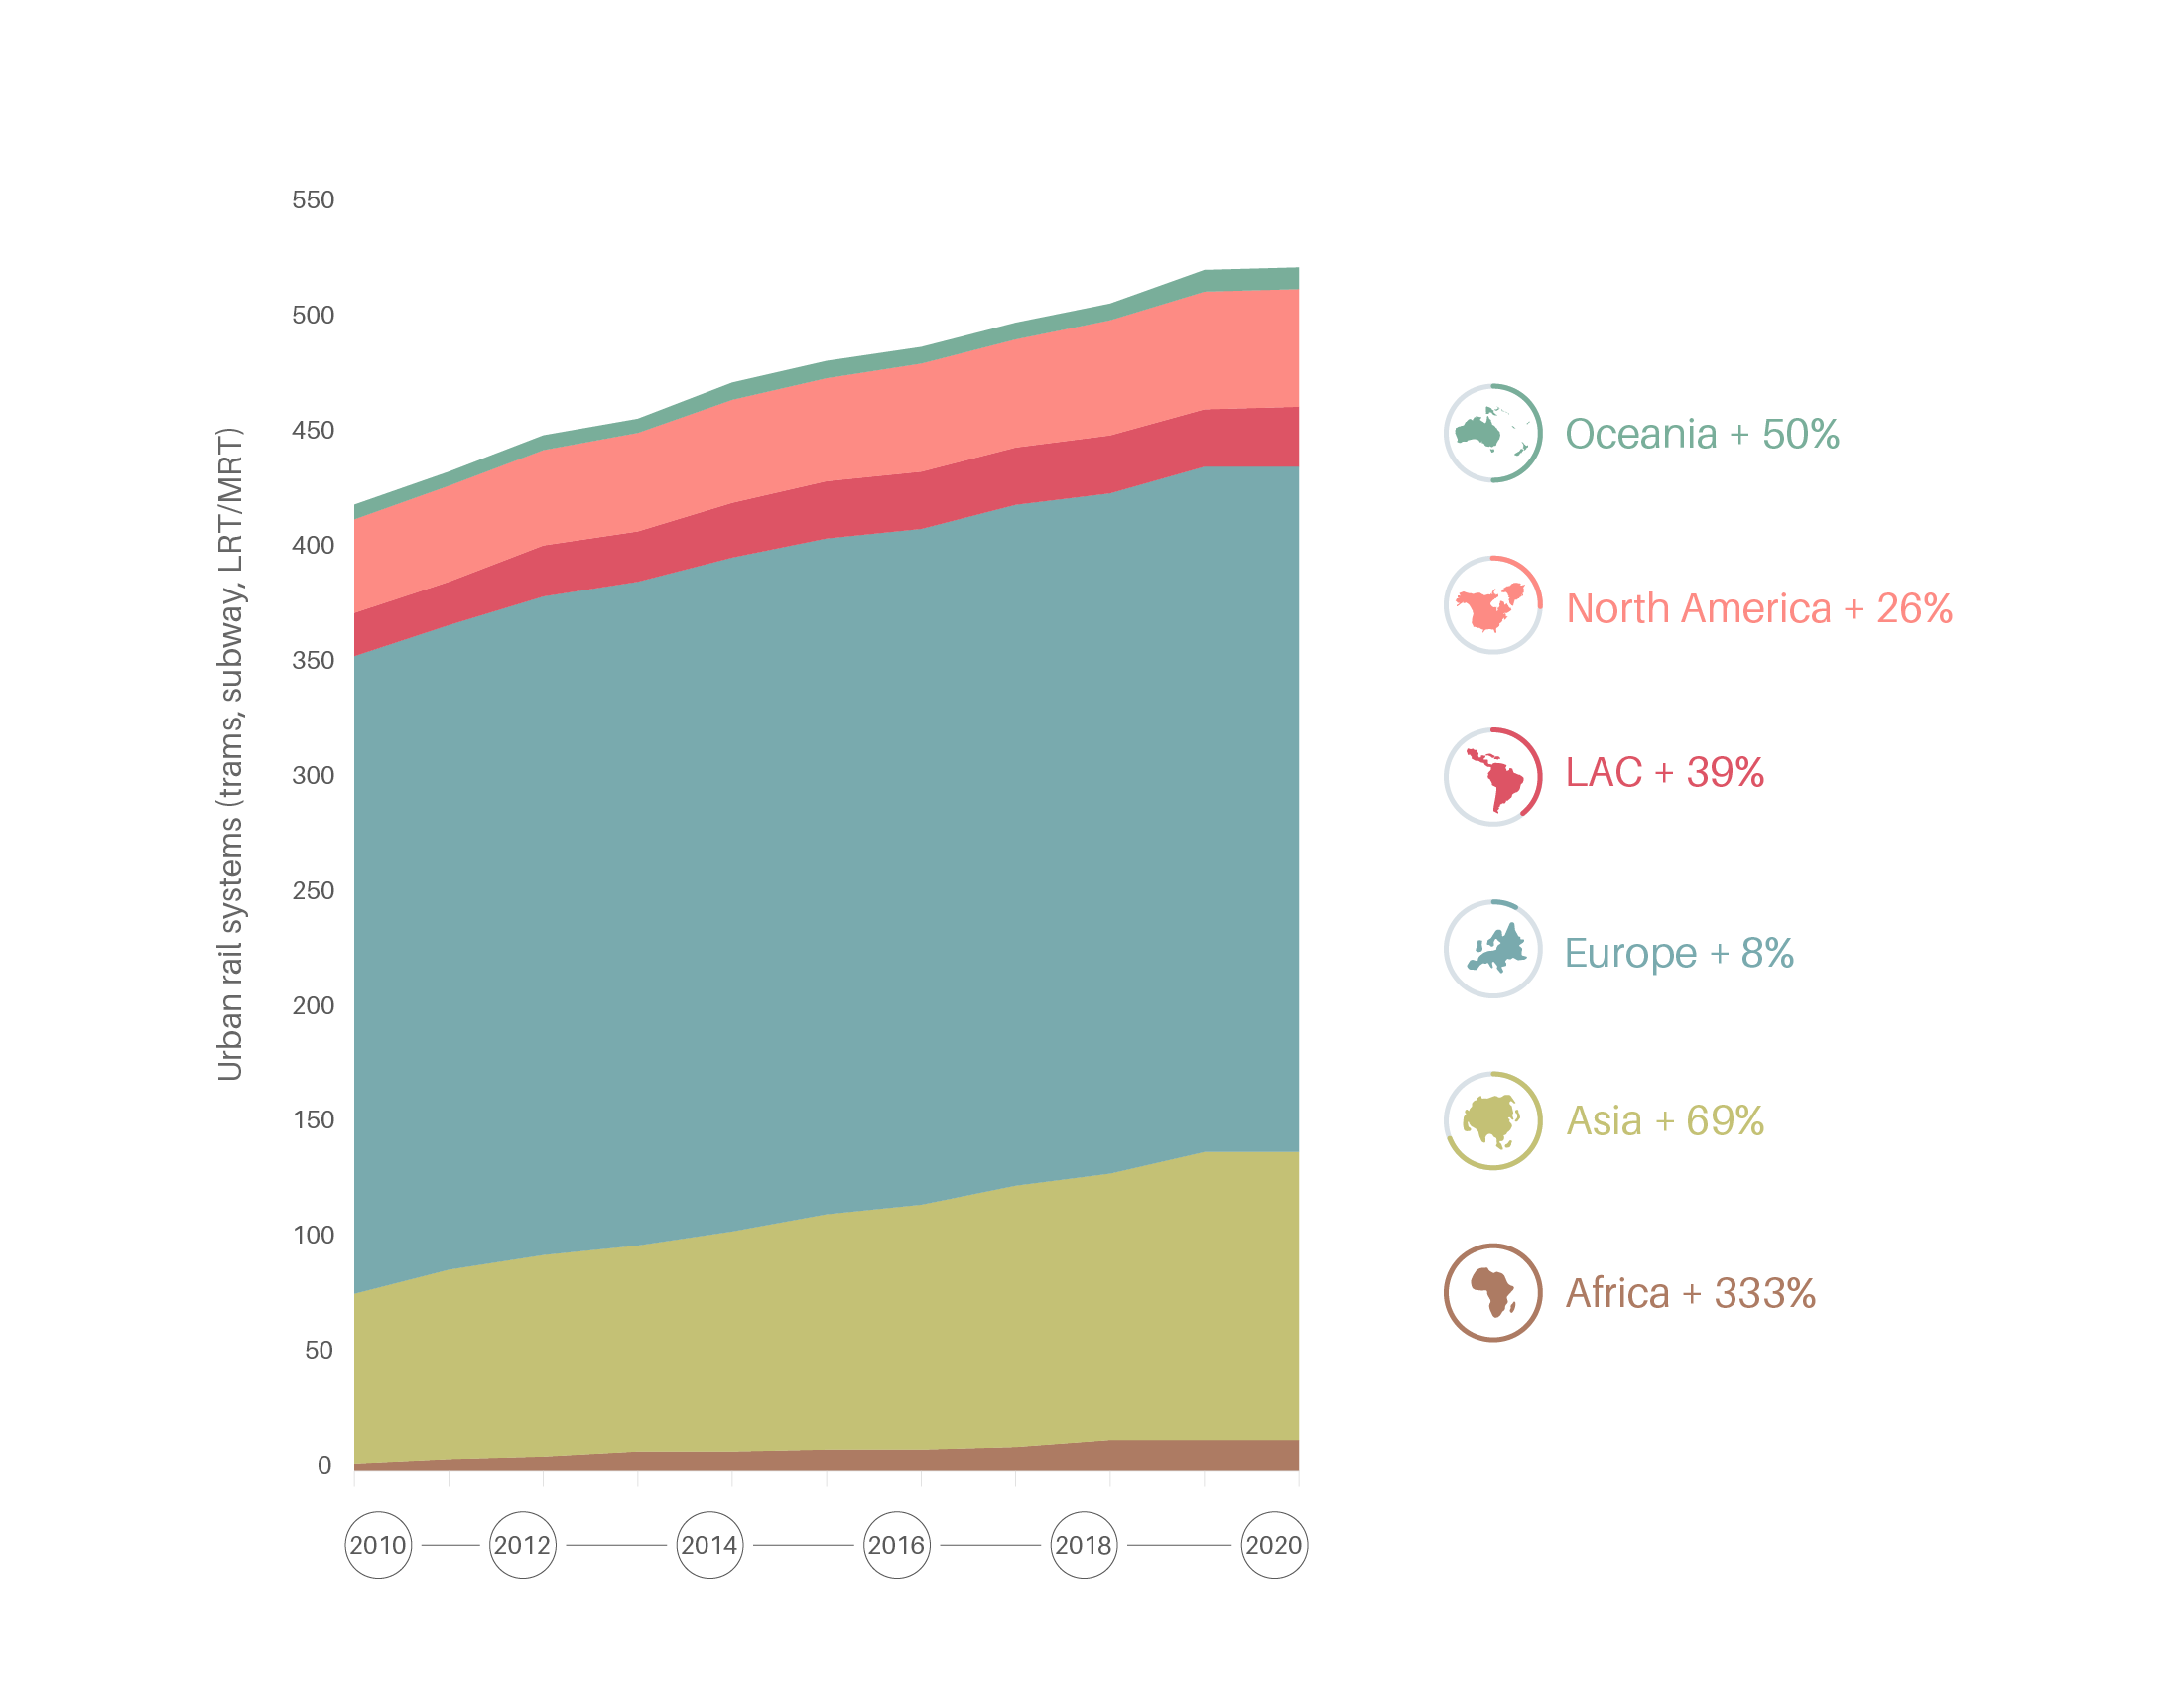
While Europe accounts for the vast majority of urban rail systems, the largest growth from 2010 to 2020 took place in Africa (333%), Asia (69%) and Oceania (50%).
Figure 2.
Development of new urban rail systems, by region, 2010-2020
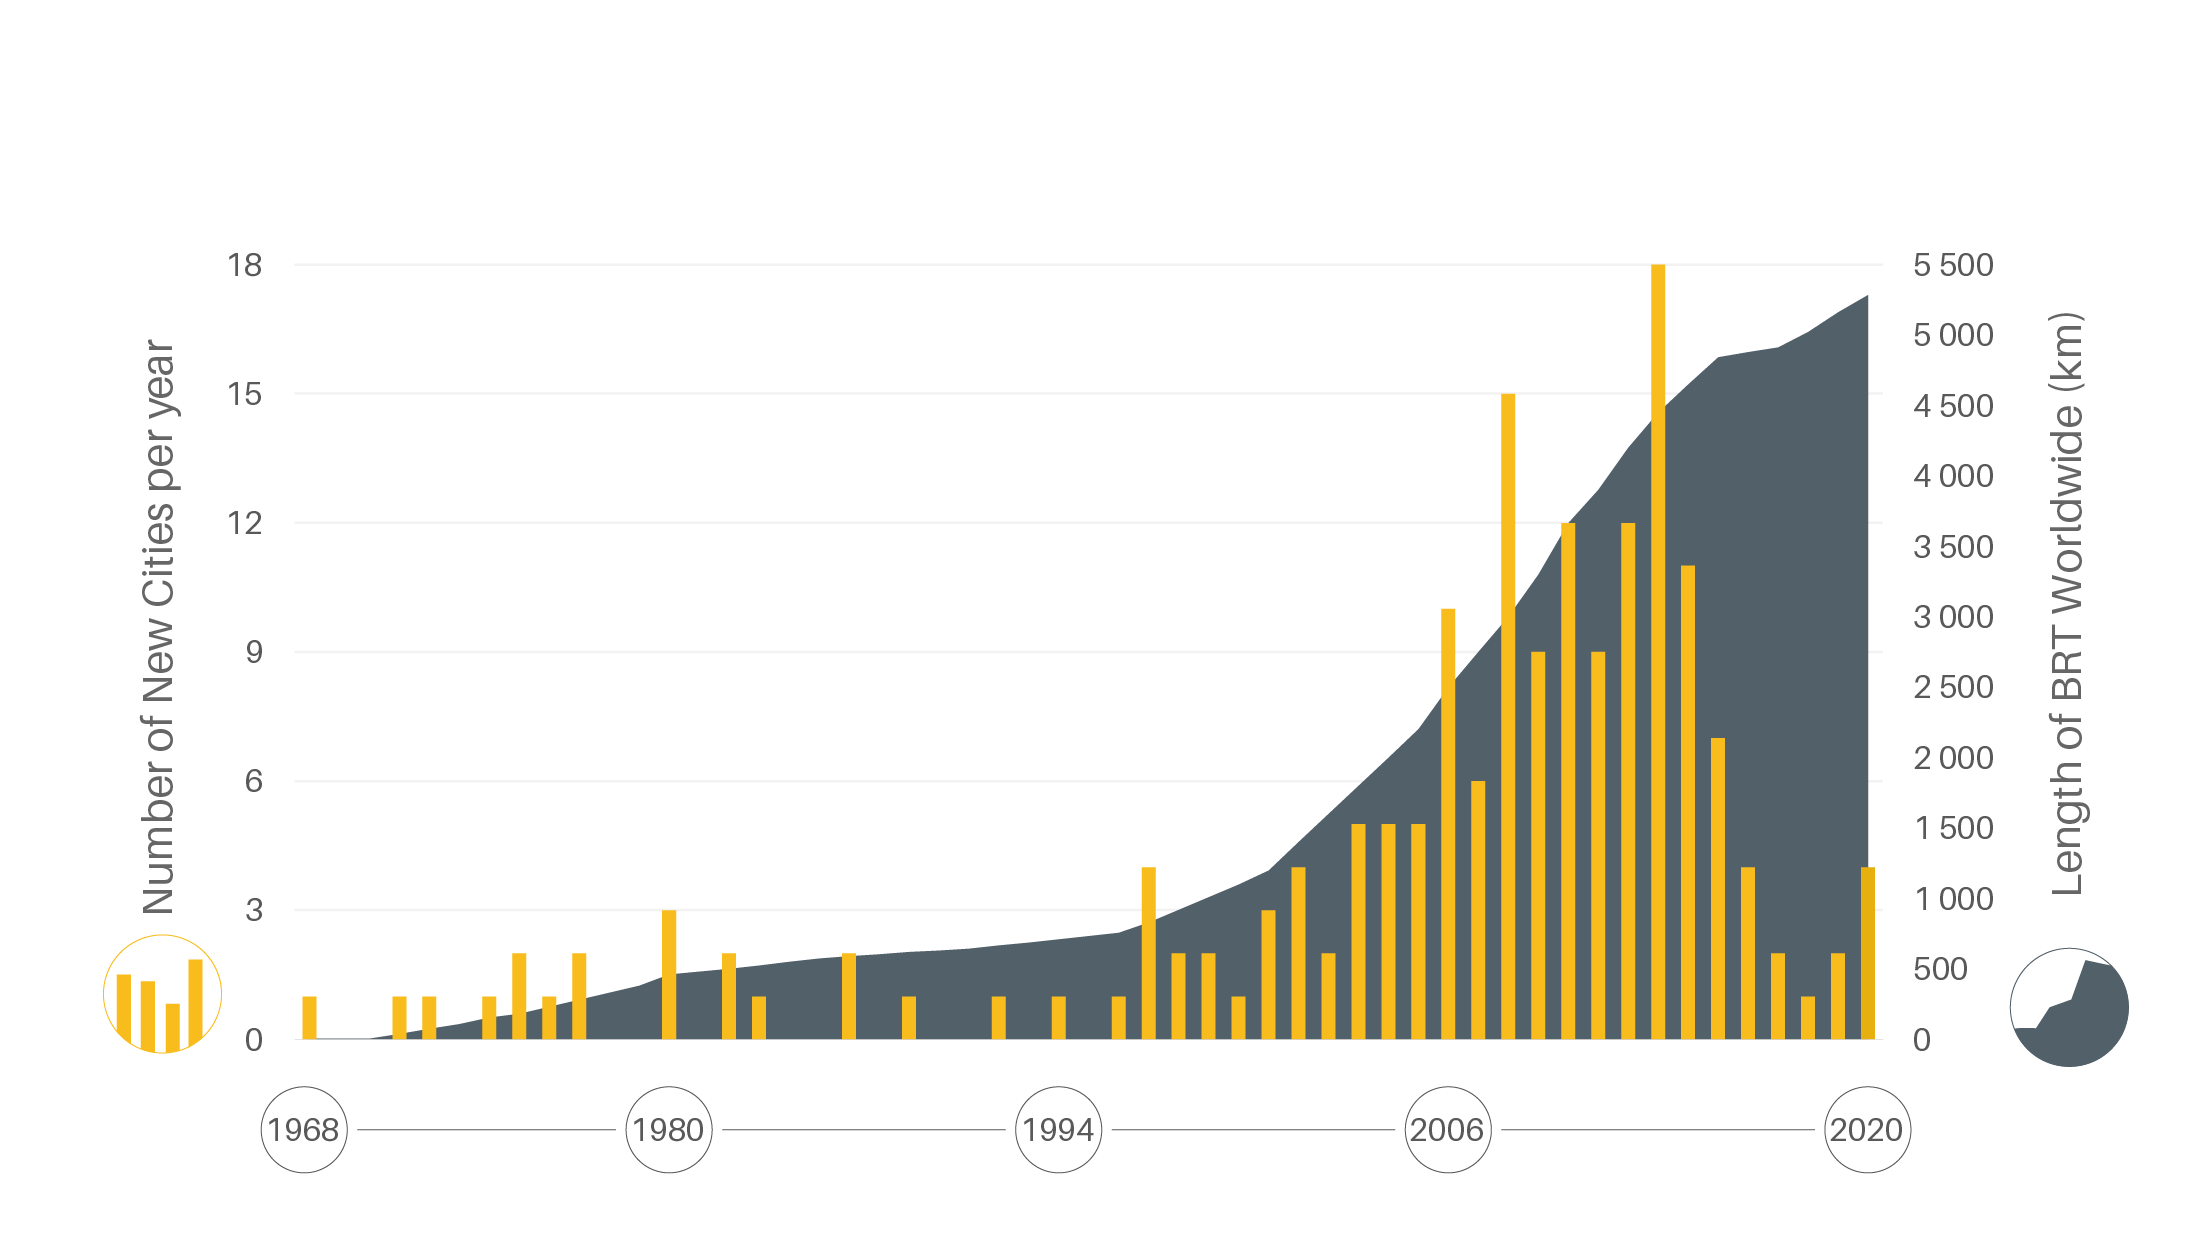
Worldwide development of bus rapid transit systems has declined significantly since its peak in 2014, although a gradual increase has occurred since 2018, with nine new systems added during 2019-2020.
Figure 3.
Evolution of bus rapid transit systems in cities worldwide, 1968-2020
Paratransit (sometimes called “informal transport”) remains the main motorised urban transport option in Africa and across cities in the developing world.
More than one-third of all urban trips globally are made on foot or by bicycle. As a large majority of trips in cities are less than 5 kilometres, walking and cycling can substitute more than 40% of short car trips.
-
Emission trends
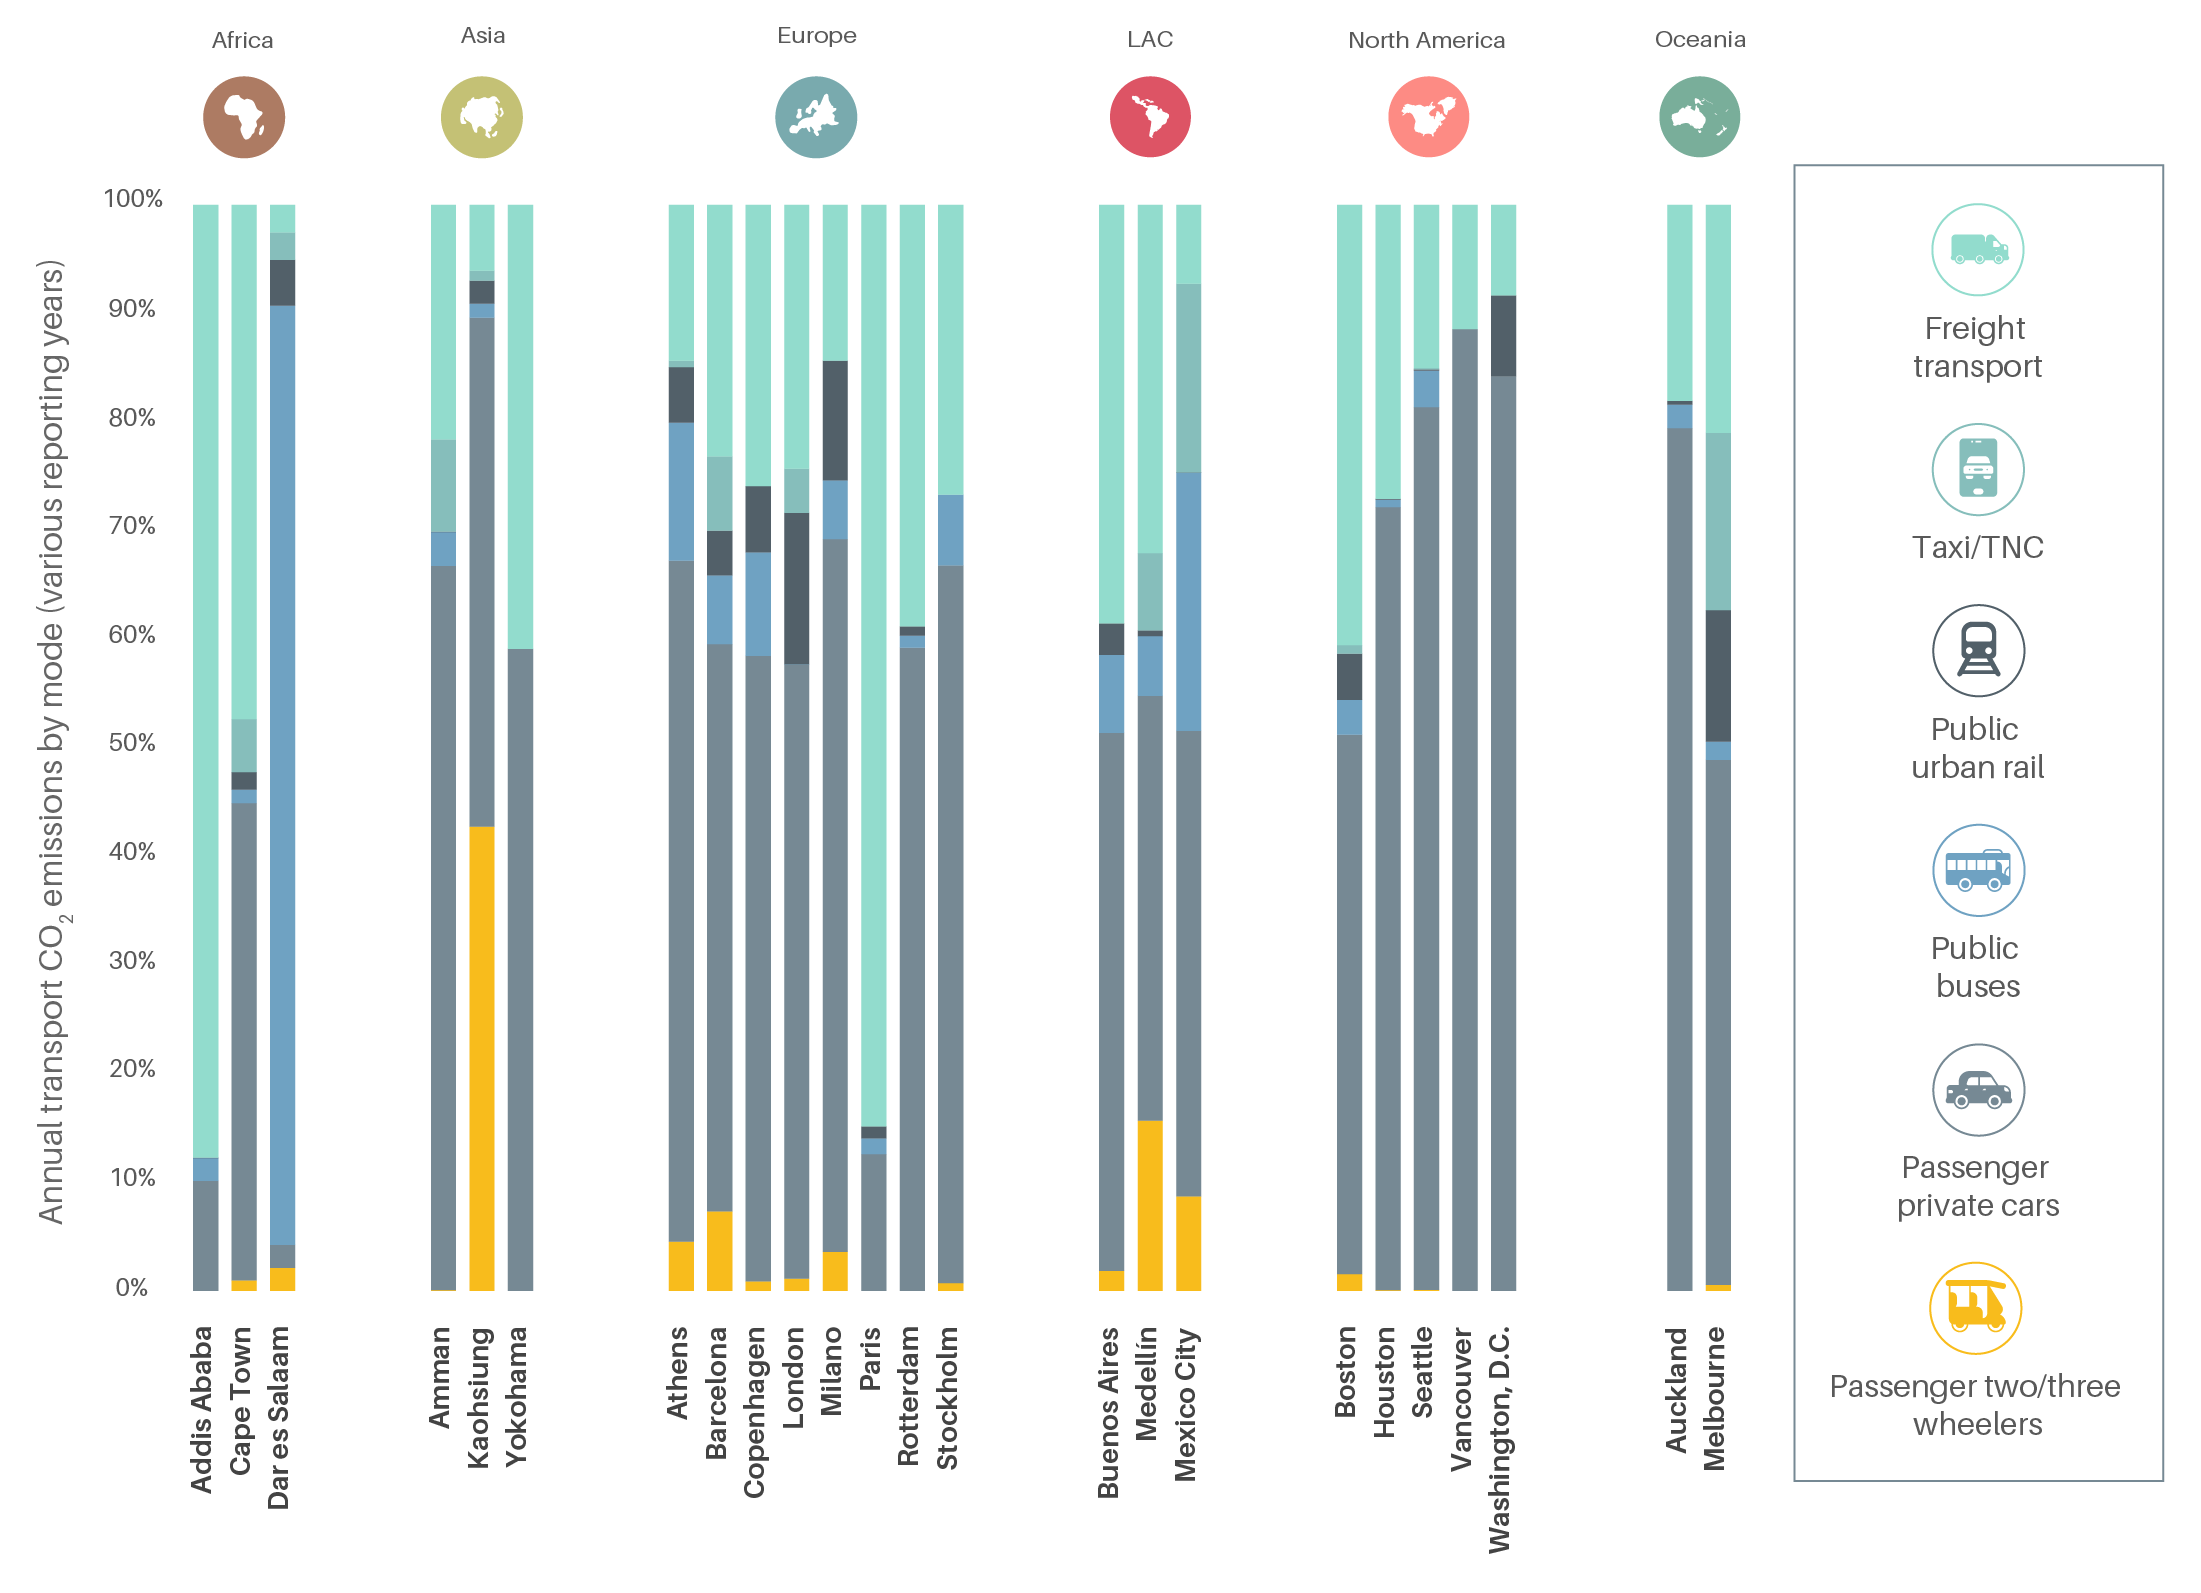
Transport emission shares from private passenger cars in urban areas ranged from less than 10% in Dar es Salaam, Tanzania to more than 80% in Vancouver, Globally, cities report widely varying shares of transport carbon dioxide (CO2) emissions, depending on their public transport investments, land-use patterns and supportive policies.
Figure 4.
Urban transport emissions by group in selected cities worldwide
Urban rail, with an average energy consumption of 0.12 kilowatt-hours per passenger-kilometre, is seven times more energy efficient per passenger than urban car trips.
-
Policy Measures
Cities around the world set ambitious targets and made financial commitments during 2019-2020 to enhance sustainable urban mobility.
Innovative pricing schemes for public transport, including free models, have been introduced to incentivise behavioural change.
As an approach to reduce congestion, improve air quality and prioritise public transport, walking and cycling, governments are exploring the use of low-emission zones (LEZs), ultra-low-emission zones (ULEZs) and zero-emission zones (ZEZs).
As commercial operations in cities become major emitters of greenhouse gases and add to congestion, freight transport policies have received rising attention from both decision makers and practitioners.
Freight policies aimed at improving the efficiency of last-mile delivery have increased in importance, given that one-third of urban truck traffic is engaged in the pick-up of goods.
LEZs, ULEZs and ZEZs can also cover freight vehicles and can restrict the access of polluting vans and trucks to city centres. Freight vehicles represent 5% of road vehicles globally but contribute 27% of transport greenhouse gas emissions and 50% of toxic air pollutants from transport.
The penetration of electric trucks in global markets for medium- and heavy-duty vehicles is projected to reach 9.4% by 2030.
Many urban freight initiatives focus increasingly on delivery using (mostly electric-assist) cargo bikes, including initiatives in Rio de Janeiro, Brazil; Copenhagen, Denmark; Hamburg, Germany; Amsterdam, the Netherlands; Kigali, Rwanda and New York City, United States (US).
-
Impacts of the COVID-19 pandemic
Due to the pandemic, public transport ridership dropped 90% globally from March to August 2020. Meanwhile, pedestrian and cycling infrastructure expanded in more than 250 cities.
The cost of allowing public transport ridership to collapse due to the pandemic – or reducing services to serve only those with no alternatives – is much greater than the cost of taking measures to make public transport safer for users and workers.
Paratransit services have been impacted due to travel restrictions, reduced capacities and rising costs. Revenue losses of 50% to 70% and lack of government support brought many paratransit operators to the verge of bankruptcy.
The COVID-19 pandemic resulted in an unprecedented preference for e-commerce and contactless deliveries (using either self-driving trucks or automated delivery robots), resulting in a re-invigoration of start-ups focused on driverless technologies.
The pandemic disrupted road freight networks worldwide, although these were generally less affected than ocean and air freight.
Key indicators
2017*
2019*
% change
Key indicators
(# of countries)
2017*
2019*
% change
Key indicators
2017*
2019*
% change
Key indicators
2017*
2019*
% change
Key indicators
2017*
2019*
% change
Key indicators
2017*
2019*
% change
(*) Data are for the indicated year unless noted otherwise.
