Executive Summary for Decision Makers

Tracking Trends in a Time of Change: The Need for Radical Action Towards Sustainable Transport Decarbonisation SLOCAT Transport and Climate Change Global Status Report – 2nd edition
The SLOCAT Transport and Climate Change Global Status Report – 2nd edition tells the global and regional stories of where we are and where we need to get to urgently on climate action in the transport sector. With contributions from more than 150 world-class experts and organisations, it is a one-stop shop for the latest available data, targets and developments on transport demand, emissions, policies and measures – showing that it is imperative to accelerate radical action for sustainable transport and climate in this time of unprecedented global change.
This Executive Summary summarises the trends and conclusions of the report and highlights threats, opportunities and uncertainties for climate action in the transport sector. The Summary describes escalating transport demand and emission trends through 2019 as well as the temporary disruption to these trends following the onset of the COVID-19 pandemic in 2020. The Summary underscores the imperative of radical action to put sustainable transport decarbonisation on the right track.
Please explore the Transport and Climate Change Global Status Report – 2nd edition for a more detailed analysis of the topics introduced in this Summary, and the “About the Report” section for more on the development of this report.

-
 What is at stake for climate action in the transport sector in a post-pandemic world?
-
 Threats, opportunities and uncertainties for transport climate action
-
 Sustainable transport decarbonisation trends in thematic areas, from A to Z
-
 Where do we go from here to achieve more equitable transport trajectories?

What is at stake for climate action
in the transport sector in a
post-pandemic world?
The years 2019 and 2020 have left an indelible mark on human and planetary history. They were two of the three hottest years ever recorded, with atmospheric levels of carbon dioxide (CO2) reaching their highest point in more than 800,000 years in March 2019 and rising nearly 50% over pre-industrial levels.1 Within this context, a global pandemic was declared in March 2020, resulting in extensive loss of life and economic hardship that increased social divides both within and between countries. The pandemic has dominated policy and funding discussions, delaying urgent global action on a growing climate crisis and widening inequalities that the United Nations 2030 Agenda on Sustainable Development seeks to address.
The COVID-19 pandemic has transformed transport and mobility patterns in every part of the world. The health crisis brought transport demand to a temporary standstill in much of the world due to lockdowns and distancing measures. While a significant population shifted to work from home, many of those who were required to commute faced reduced transport options. Demand for public transport and air travel plunged, while walking and cycling rates surged on reconfigured streets. Global maritime trade dropped around 4% in 2020, with about 12% of the container fleet idled at the peak of initial lockdowns.2 These trends caused oil demand to plummet temporarily, brought transport emissions to a near halt, and cleared some urban skies for the first time in memory. While global CO2 emissions dropped an estimated 5% overall in 2020, emissions from transport fell nearly 20%, more than any other sector.3

Despite the pandemic’s impact on transport demand, transport emissions are still not on the right track. The transport sector was the fastest growing fossil fuel combustion sector worldwide from 2010 to 2019, with sectoral emissions rising more than 17% during this period.4 In absolute terms, transport was the second-highest emitting sector (along with industrial emissions) in 2019.5 Increases in road, aviation and shipping activity (both passenger and freight) were leading factors behind global growth in transport CO2 emissions from 2000 to 2019.6
In order to meet Paris Agreement targets and to keep the rise in the average global temperature below 1.5 degrees Celsius (°C), transport emissions will need to drop two-thirds below 2019 levels (or by 8 gigatonnes (Gt) of CO2) by 2050.7 Therefore, the temporary reduction in transport emissions experienced during the pandemic in 2020 is roughly equal to the reductions needed annually to meet 2050 targets and to close the transport emissions gap.8 However, as of May 2021, only 15% of the 54 second-generation Nationally Determined Contributions submitted by countries under the framework of the Paris Agreement included a specific target for reducing transport emissions, showing limited progress towards meeting key goals.9
The pandemic has underscored the need for policy makers to take bold steps to address catastrophic impacts to transport and mobility systems. However, while some leaders and practitioners – often at the local level – have demonstrated willingness to take short-term action on mobility to increase access and well-being (e.g., by reallocating road space and supporting public transport), others have hesitated to take bold steps. These mixed responses have catalysed renewed commitments from policy makers and activists to stabilise the climate while increasing equity, inclusion and social justice, through climate strikes and other actions.
Pandemic recovery packages so far have proven a mixed bag for climate action in the transport sector. While a number of national recovery packages have firmly embraced a goal to “build back better” (e.g., by promoting electric vehicles or shifting from air travel to rail), many have upheld the status quo (e.g., by backtracking on fossil fuel subsidy reform or providing unconditional airline bailouts) rather than adopting green and equitable recovery strategies for transport systems. The pandemic has also led to severe budget cuts in some national aid programmes, threatening to widen social and economic divides between the Global North and South and to push meaningful climate action even further into the future (see Section 4 on Financing Climate Action in Transport).10
In a time of global uncertainty, we face three divergent scenarios for climate action in the transport sector:
Abandon meaningful climate action in the transport sector and follow a business-as-usual approach to mobility patterns and investment trends (projected to yield a scenario of a 4+ °C increase);

Continue incremental progress on transport mitigation and increase the focus on adaptation, despite limited progress over the past 40 years amidst economic booms and rapid growth
(3-4 °C scenario);

Accelerate radical action on transport behaviour and investments, while prioritising the triple impacts of transport decarbonisation, job creation and equitable accessibility
(1.5-2 °C scenario).11

Only radical action will contribute to meeting ambitious Paris Agreement targets and achieving the Sustainable Development Goals. Only radical action will guarantee the balanced Avoid-Shift-Improve approach that is needed: to Avoid unnecessary motorised trips based on proximity and accessibility; Shift to less carbon-intensive transport modes; and Improve vehicle design, energy efficiency and clean energy sources (see Section 1.1 on Global Transport and Climate Change). Only radical action will ensure that sustainable, low carbon transport and mobility is a vital component of an equitable, healthy, green and resilient pandemic recovery.12

Threats, opportunities
and uncertainties for
transport climate action
Threats
Transport CO2 emission trends – in most countries and regions – are not moving in the right direction. In 2019, transport was the top or second-highest CO2-emitting sector in more than three-quarters of the world’s countries, and from 2010 to 2019, total transport emissions decreased in only a fifth of countries. High-income countries contributed half of transport emissions during this time, with per capita emissions nearly 15 times above 2050 Paris Agreement targets.14 Rising transport emissions have been driven by rising automobile use and plummeting public transport ridership due to the pandemic. (See Section 1: Global and Regional Overview.)

Transport emission trends have progressed unevenly across regions, sectors and income groups. Europe was the only world region that stabilised its transport CO2 emissions over the past decade, while transport emissions surged more than 20% in other regions.15 International aviation and shipping grew 37% and 10%, respectively, over the decade, yet these sources remain uncounted in most national emission inventories (outside of the European Union, EU).16 Member countries of the Organisation for Economic Co-operation and Development (OECD) and non-OECD countries currently contribute roughly equal shares of transport CO2 emissions, reflecting the approximate split of global GDP.17 However, between 2010 and 2019, transport CO2 emissions grew 4% in OECD member countries and 34% in non-OECD countries, suggesting a growing divergence.18 (See Section 2 on Transport Demand, Emissions and Targets.)
In the face of this growth, the ambition to mitigate transport emissions in countries’ Nationally Determined Contributions (NDCs) is falling short. The United Nations Framework Convention on Climate Change extended the timeline for countries to submit second-generation NDCs until 9 to 12 months before the 2021 UN Climate Change Conference (COP26, postponed to November 2021).19 However, the sector is not on track to meet emission reduction targets for 2050.
Under a business-as-usual pathway, transport CO2 emissions could increase from 8 Gt in 2019 to 14.5 Gt in 2050.20 Yet, as of May 2021, only 15% of NDC submissions (representing 7 countries and the EU-27, out of 54 total submissions) had set transport mitigation targets in revised NDCs.21 Long-term low emissions development strategies (LT-LEDS) focus strongly on Improve measures (more than half of all measures), whereas Shift and Avoid measures (7% each) are less well-represented.22 (See Section 3 on Responses to Address Climate Change in the Transport Sector.)

Accelerating action on transport sector resilience to climate change impacts is falling short in country plans. Although adaptation strategies are a required element of NDCs, only 28% of submissions (15 total) as of May 2021 included specific transport adaptation measures.23 Most National Adaptation Plans (NAPs) and National Adaptation Programmes of Action (NAPAs) offer few details on transport measures, and only 50% of submissions (11 total) since 2015 have specifically included them.24 With no new NAPAs submitted in the last four years, the adaptation gap in least-developed countries is growing wider.
Financing has not kept pace with growing needs for sustainable, low carbon transport in most cities and countries. Climate-focused transport spending has been overshadowed by “brown investments” in highways and other carbon-intensive transport infrastructure, with two-thirds of infrastructure investments (totalling USD 586 billion per year in the 50 largest economies) in 2015 going to road transport.25 Fossil fuel subsidies continue to outpace renewable energy spending in transport budgets by orders of magnitude. Similarly, many COVID-19 recovery packages and bailout programmes have invested more heavily in fossil fuel-related companies than in clean energy, a trend that is likely to drive transport emissions upward.26 (See Section 4 on Financing Climate Action in Transport.)
Electric mobility is not a silver bullet for transport decarbonisation and requires a holistic notion of sustainable mobility. Most policy attention is focused on private vehicles, and much current dialogue fails to consider realities in the Global South (including the widespread import of used vehicles).27 Electric vehicles accounted for around 25% of motorised two- and three-wheelers and 18% of public buses, but only 1% of private passenger cars in 2020.28 Electric mobility has limited potential in aviation, shipping and heavy-duty trucking, and it will only fully decarbonise transport if it is powered with renewable energy. Electric mobility requires differentiated strategies by region and a greater focus on shared fleets (including electric buses, mini-buses, and two- and three-wheelers); otherwise, its expansion will simply lead to cleaner congestion. (See Section 3.8 on Electric Mobility.)
Opportunities
Commitments to phase out internal combustion engines are driving more sustainable emission trajectories. Low carbon transport measures are becoming increasingly efficient and leading to more positive trends than were previously projected. Whereas in 2017 the emission gap between the projected business-as-usual and low carbon transport emission levels was estimated to reach 16 gigatonnes of CO2 by 2050, newer estimates (based on studies up to 2019) show a smaller gap of around 12 gigatonnes.29
Targets for phasing out the use of internal combustion engines (and for phasing in electric vehicles) are accelerating the pace of transport decarbonisation. So far, 19 countries, at least 11 cities and regions, and a number of automobile manufacturers have announced phase-out commitments.30 Accelerated uptake of electric mobility has been coupled with halting progress towards divestment from fossil fuels – including recent rulings against Chevron, Exxon and Royal Dutch Shell for dragging their feet on climate action – and some oil companies endorsing
carbon pricing.31

Technological advances are reshaping the landscape, as plunging battery prices are making electric vehicles more affordable for many users, especially in the Global South.32 More-affordable batteries are facilitating the rapid scale-up of electric bicycles in Europe, North America and South Asia, and of electric bus fleets in leading e-bus countries such as China, Chile and Colombia.33 While tested solutions are plentiful, there is a need for more dedicated champions and more sustained financing to make them the rule rather than the exception.
Established emission reduction measures are complementing emerging technological advances. Increasing fuel economy and quality standards for light- and heavy-duty vehicles continues apace, with 30 countries actively improving fuel economy-related policies since 2018, and nearly 80% of all light-duty vehicles sold as of 2017 subject to such regulations.34 Limiting imports of polluting used vehicles in the Global South is progressing, as reflected in the recent commitments of 18 countries in Africa, Asia and Latin America.35
Many low-carbon transport measures can be implemented quickly and inexpensively with sufficient political will. Many short-term policy measures have been implemented during the pandemic, which saw “tactical urbanism” measures – such as the deployment of open streets in more than 194 cities globally as of October 2020 – that allow millions of people to reimagine their daily mobility needs.36 Active transport (walking and cycling) has increased in many cities, and Europe quickly built 1,500 kilometres of bicycle lanes, allocating EUR 1.7 billion (USD 2 billion) for cycling promotion.37

Uncertainties
A number of uncertainties – many of them heightened by the pandemic – have the potential to enhance, accelerate or reverse the positive impacts of climate action in the transport sector. Anticipating and addressing such uncertainties, while capitalising on emerging opportunities and addressing looming threats, can maximise positive outcomes for sustainable, low carbon transport. Important questions remain in a diverse range of issue areas, as outlined below.
Sustainable mobility in cities
- Will public transport systems struggle due to underinvestment, dwindling revenues and remote work? Or will they recover ridership in the short term and regain public trust?
- Will tactical urbanism and improved spaces for walking and cycling become default strategies? Or will car traffic surge back on reconfigured streets along with growing economic activity?
- Will ride-hailing continue to revolutionise urban and suburban mobility markets while increasing traffic? Or will these services be deployed more efficiently to support accessible, low-carbon transport?
Inter-urban and international transport and mobility
- Will global supply chains be diminished by the pandemic, with manufacturing relocating to regional and national centres? Or will supply chains innovate and adapt to current challenges?
- Will aviation demand trends be permanently reshaped by behavioural change and reorientation of economic activity? Or will future travel and tourism adopt new patterns and protocols?
- Will land-based freight transport shift more broadly from road to rail and inland waterways (e.g., with fossil fuel phase-outs)? Or will high-carbon investments and operations remain the rule?
Effects of pandemic recovery responses
- Will recovery packages, the largest historical global mobilisation of public funds, yield unintended consequences? Or will there be accountability in how public funds are deployed in practice?
- Will massive post-pandemic government debt mean less money for sustainable, low carbon transport in the future? Or will recovery packages accelerate an irreversible transformation to sustainable, low carbon transport through innovative measures (e.g., shifting from air to rail travel)?
Anticipating and monitoring such uncertainties, while capitalising on emerging opportunities and addressing looming threats, will maximise positive outcomes for climate action in the transport sector.


Sustainable transport decarbonisation trends
in the thematic areas,
from A to Z
Following on the threats, opportunities and uncertainties covered above, we investigate here a number of promising and challenging trends over the past two years – in areas from Aviation to Zero-emission vehicles – that will establish the direction of sustainable, low carbon transport for years to come. (Note: these are selected highlights from the full SLOCAT Transport and Climate Change Global Status Report – 2nd edition; see cross-referenced sections for more detail.)


Access to sustainable transport is critical for climate action; yet in many cities, more than half of residents lack access to opportunities within 60 minutes’ travel time.38 For example, in Mexico City and Johannesburg, South Africa, 56% and 42% of urbanites, respectively, are under-served in their ability to reach job locations.39 Much of the world’s rural population lacks adequate transport access: in rural sub-Saharan Africa, 65% of people live more than 2 kilometres from a weatherised road, stranding many from life-saving healthcare and market opportunities that improve farming productivity and earnings.40 Increasing access for urban and rural residents requires improving conditions for walking and bicycling, developing better inter-city bus or other shared transport routes, and creating proximity-based transport planning approaches (e.g., 15-minute cities) in cities across both the Global North and South.

Aviation has received insufficient climate policy attention, despite a nearly 40% increase in emissions between 2010 and 2019.41 Passenger and freight aviation were responsible for around 10% of global transport CO2 emissions in 2018.42 The aviation sector is challenging to decarbonise due to high energy requirements, constraints to the scale-up of biofuels and challenges with electrification. The ambition of international bodies fall well short of Paris Agreement targets, and the International Civil Aviation Organization’s Carbon Offsetting and Reduction Scheme for International Aviation (CORSIA) has set a weak baseline, which at best would only stall emission growth, which is projected to increase 290% by 2050.43 While industry commitments to reducing emissions are a step in the right direction, meaningful impacts are decades off.44 Aviation provisions in pandemic recovery packages generally prioritise economic health over environmental well-being, delaying climate action further.


Behavioural change is an essential element of climate action, and policy makers will need to enforce safety measures in public transport to regain trust. During the pandemic, many essential workers and those with low-income jobs (especially in the informal sector) have not had the option to shift to teleworking, and many have had to maintain existing travel patterns. Evidence indicates that people have changed their attitudes towards transport, and the current scenario favours the development of new and sustainable social norms (e.g., the public bike-sharing system in Seoul, Republic of Korea recorded more than 2.7 million rides during June 2020, compared to 1.2 million rides in June 2019).45 Trying new ways of travelling during the pandemic and having positive experiences may trigger new behaviours in the future. New policies and investments in infrastructure and enforcing safety measures in public transport will help increase citizens’ trust in less carbon-intensive transport options and will nudge behaviours.


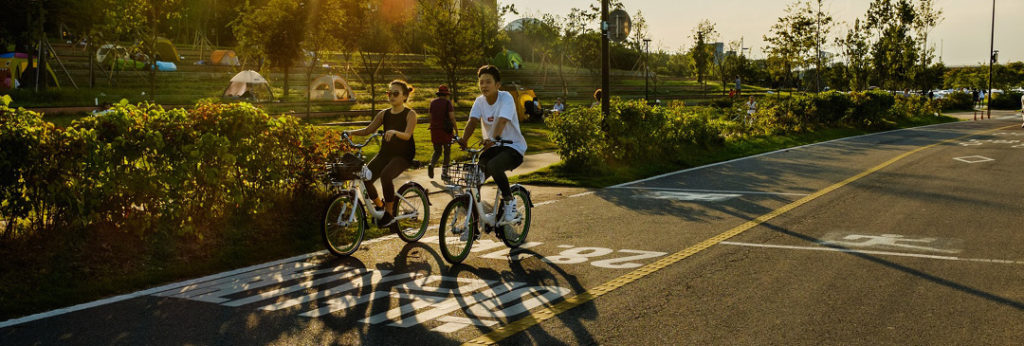
Cycling is a near zero-emission transport mode that has gained momentum during the pandemic, yet further investment is needed to maintain increased demand.46 Cycling activity and investment have surged during the COVID-19 pandemic (e.g., the cycling mode share in Bogotá, Colombia increased from 23% to 37% pre- and post-pandemic, and more than 2,300 kilometres of new cycling lanes were announced in 37 of the 94 biggest European cities as of December 2020).47 Electric bicycle sales increased 120% globally in 2019 and surpassed a 50% market share in the Netherlands.48 More than 150 million e-bikes were in use in 2019, a total that is projected to double by 2023.49 Despite positive trends, cycling’s share of transport trips remains low in most cities and regions. Optimising cycling’s potential to mitigate transport emissions will require investing in bike lanes and parking, planning and institutional capacity, and increasing the affordability of e-bikes across regions.


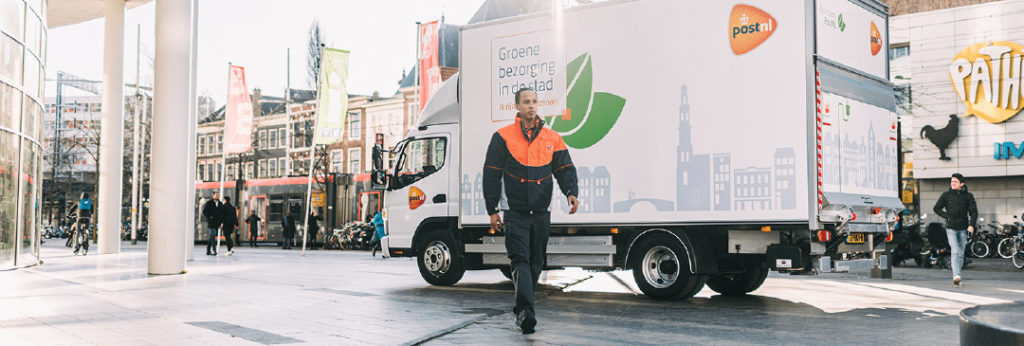
Freight transport accounts for around 40% of transport emissions globally, yet green freight measures are not proportionally reflected among policy priorities.50 Road freight accounts for a large share of freight impacts (as heavy-duty trucking is difficult to decarbonise), although some multilateral solutions are emerging.51 Rail, maritime and inland waterway transport can help offset road freight impacts, but investment trends are still insufficient to rein in freight emissions, which are projected to nearly triple between 2015 and 2050.52 Electrified and human-powered two- and three-wheelers are reducing urban freight emissions, and corporate actions are driving low-carbon solutions that leapfrog local and national policies.53 The COVID-19 pandemic increased the demand for home deliveries, with some countries seeing a more than 20% increase in e-commerce between 2019 and 2020.54 At the same time, the disruption of global supply chains led to a sharp decline in seaborne trade and has challenged equitable access to goods and services.55 While “green” logistics strategies have emerged, more must be done to stem rising freight emissions (e.g., investments in freight rail and inland waterways, emission standards for heavy-duty vehicles).


Gender-sensitive sustainable mobility planning is critical to increasing access to essential opportunities for girls and women, while advancing transport decarbonisation.56 Limited access to transport in developing countries is the greatest obstacle to women’s participation in the labour market, reducing their probability of participation by 15.5%.57 Recognising the crucial role of sustainable infrastructure in advancing gender equality, the 2019 session of the United Nations Commission on the Status of Women recommended the creation of inclusive transport.58 To capitalise on the untapped potential to transform gender inequalities, mobility and urban planning must take into account the different needs of girls, women, boys and men (e.g., in many cities, women take public transport and walk with greater frequency than men).59 This also requires removing barriers to girls’ and women’s access to sustainable mobility (e.g., by establishing safe physical distance on public transport).


Inter-city passenger transport demand has been steady in recent years, driven largely by fossil fuel subsidies and car-friendly measures in pandemic recovery packages. Inter-city passenger transport accounts for roughly a third of total transport emissions due to longer distances and fewer public transport options.60 Demand has surged due in part to rising car ownership and use in both the Global North and South. At the same time, inter-city railway development has been concentrated in only a handful of countries (e.g., half of the global high-speed rail network is in China).61 Rural roadways are a lifeline for roughly 45% of the world’s population, yet they account for a disproportionate share of road crashes, with inefficient and unsafe vehicles travelling on under-maintained infrastructure (e.g., in Africa, road fatalities are nearly 50% higher than the global average).62 Reducing emissions and casualties from inter-city passenger transport will require shifting demand to lower-carbon rail and bus travel. (See Section 3.5 on Passenger and Freight Railways.)


Maritime shipping emissions could be reduced more than 75% by 2050 by adopting sustainable biofuels, better utilising capacity and optimising vessel speeds.63 Shipping accounted for more than 80% of trade by volume and 11% of global CO2 emissions in 2019.64 International maritime transport is challenging to decarbonise due to high initial investment costs and the long life spans of vessels.lxv Despite limited policy action, the shipping industry appears to have attained its 2030 target for improving carbon intensity, even before the onset of the pandemic; however, the industry is far from meeting its 2050 emission reduction target (which is rated “insufficient”).65 Progress in reducing emissions will require stronger policy support and increased public-private co-operation.


Public transport is a key strategy for decarbonisation, yet the world’s public transport systems require far greater investment to recover from the pandemic-driven loss in ridership. Although metros, trams and bus systems are a backbone of low carbon transport in many cities, they have not gained ground over private vehicle use, and investment in and repair of public transport systems continues to lag in many cities. Urban rail is seven times more energy efficient per passenger-kilometre than urban car trips, and electric city buses are up to ten times more efficient.67 Urban rail development has grown steadily since 2010, with numerous new systems emerging in the Global South, and systems expanding in many countries, led by Asia.68 However, bus rapid transit has fallen short of its initial promise, with only nine cities adding new systems globally between 2019 and 2020.69 Paratransit (also called “informal transport”) is a critical service in the Global South, with minibuses and motorcycle taxis carrying 80% of riders in some cities.70 Decarbonising public transport requires increasing investments to address pandemic ridership loss, generating new funding streams, increasing electrification and properly pricing high-carbon transport modes.


Renewable energy is a crucial component of transport decarbonisation, yet renewables accounted for less than 4% of energy use in the sector in 2018.71 Key conduits for greater integration of renewable energy are railways, which account for the highest share of renewables in the sector, and two, three- and four-wheeled electric vehicles.72 However, policies to scale up vehicle electrification and renewable energy remain largely unconnected. Whereas aviation faces obstacles to broad integration of renewables, shipping holds greater potential through the use of hydrogen and ammonia fuels generated from surplus wind and solar energy.73 Moving the needle on renewables for transport requires reducing the cost of advanced fuels; strengthening policy and technical linkages between electric vehicle development and renewable energy generation; and using electric vehicles as energy storage devices though consumer and utility incentives.


Shared mobility services will need to be more integrated and electrified to achieve largely untapped decarbonisation potential. Shared mobility services (e.g., shared two-, three- and four-wheelers, and ride-hailing services) have expanded globally following their initial roll-out in Asia, Europe and North America. In the past decade, car-sharing membership in Asia increased nearly 20 times (to more than 22 million members); bike sharing systems in Europe increased four-fold (to around 1,000 systems); and Africa launched more than 180 app-based motorcycle services.74 The COVID-19 pandemic has reshaped the shared mobility landscape, with demand for shared bikes, e-bikes and scooters soaring, and with some ride-hailing companies shifting from passenger transport to food delivery due to falling demand.75 Electric scooter and bike-sharing services have helped to reduce emissions by shifting trips from polluting modes, whereas ride-hailing services increase the vehicle-kilometres travelled and result in more emissions.76 To optimise the potential for shared mobility to reduce emissions, these services need to be made available in poorer and more remote neighborhoods and to bridge the needs of public and private actors.

Sustainable urban mobility plans (SUMPs) offer significant low carbon benefits but require more substantial funding to translate plans to action. SUMPs have expanded as a strategy to meet urban mobility needs through a collaboration of public and private sector actors, citizens and other key stakeholders.77 While SUMPs focus on mobility in cities, national urban mobility policies (NUMPs) provide enabling frameworks for local-level planning. During 2019 and 2020, the number of SUMPs and NUMPs increased 6% globally, and growth has been particularly strong in the Global South, with Latin America accounting for 16% of the more than 1,600 global SUMPs as of 2020.78 SUMPs are strengthened by measures aimed at transport demand management, such as low-emission zones, which have surged alongside demand for improved urban air quality. As SUMPs reach critical mass in the Global South, peer countries can emulate successful policies and learn from key lessons.


Walking is the dominant (zero-emission) transport mode in much of the Global South, yet a significant investment gap remains between walking and motorised transport infrastructure.79 Walking accounts for 70% of trips globally and is a component of nearly every trip taken.80 Walking and cycling can substitute for more than 40% of short car trips; this could save nearly 5% of CO2 emissions from car travel on top of the existing estimated 5% of “avoided” emissions from walking and cycling trips.81 Nevertheless, walking shares are declining in many parts of the world, and 21% of road traffic crashes involve pedestrians.82 In response to the COVID-19 pandemic, nearly 200 cities globally have created pedestrian-only spaces and/or protected bike lanes.83 It remains to be seen how many temporary measures will be translated to long-term policies and infrastructure investments.


Zero-emission vehicles (ZEVs) have gained momentum globally; however, maximising their benefits will require increasing affordability and mobilising dedicated champions. ZEVs (e.g., electric vehicles, fuel cell electric vehicles, solar vehicles) are often misperceived as a silver bullet for transport decarbonisation. Electric vehicles produce around 20% fewer CO2 emissions than internal combustion engines even when the electricity for charging is generated from fossil fuels.84 In 2020, sales of plug-in hybrid and electric vehicles increased 70% to reach 4.6% of total new vehicle sales, and roughly 350 million electric vehicles made up 25% of the global motorised two- and three-wheeler stock.85 However, ZEVs remain a small fraction of global fleets, and sales of oversized vehicles (particularly sport utility vehicles, or SUVs) outweigh the emission benefits of ZEVs. Increased fuel economy standards are a crucial complement to ZEVs, and restrictions on the import of used vehicles are reducing emissions and improving air quality in Asia, Africa and Latin America.86 Although electric vehicles are more efficient than conventional vehicles, they offer far greater potential for reducing emissions if powered by clean, renewable energy.

Where do we go from here
to achieve more
equitable transport trajectories?
This A-to-Z overview of trends in selected thematic areas raises several key questions: How can we accelerate climate action to move transport emissions in the right direction? Can we get there in time to prevent the most severe climate impacts? And, amidst the lingering pandemic, are we building back better? So far, these questions have all been met with a resounding “No… or at least not yet.”87
Radical action is needed to deliver on Paris Agreement targets and Sustainable Development Goals to achieve an equitable 1.5 °C world and to adopt more sustainable development pathways. However, it will take concerted efforts and dedicated resources to stabilise accelerating climate change. To keep global temperature rise below 1.5 °C, annual transport CO2 emissions must drop to 2-3 Gt, which means reducing per capita transport emissions from 0.88 tonnes in 2019 to 0.2 tonnes in 2050.88 This will require strong policy support, financial incentives and more equitable mobility options worldwide.
Radical action will necessitate taking unprecedented risks and creating positive disruptions. It is critical to anticipate and embrace short-term turbulence to ensure a more just transition in the long term. We see four primary building blocks to harness momentum on climate action for transport and to enable the radical action needed to decarbonise the sector:
A - Tackling major threats
Reversing ongoing threats to climate action in the transport sector will require raising the ambition on mitigation and adaptation in NDCs and LT-LEDS and delivering on that ambition. However, while 13 of the 54 second-generation NDCs submitted as of May 2021 set higher targets for reducing economy-wide emissions, current pledges would still lead to warming of 2.6 °C by 2100, far exceeding Paris Agreement targets.89 Aligning NDC and LT-LEDS processes with national transport policies and investment strategies remains a critical need.90
- Raising mitigation ambition will require demonstrating that making systemic changes to reduce transport emissions can enhance rather than diminish quality of life – i.e., sustainable urban mobility plans can lead to economic prosperity, personal well-being and decoupling of transport emissions.
- Increasing attention to adaptation will require leveraging the power of reverse linkages (i.e., South-North exchanges), as many successful adaptation solutions are emerging under the most vulnerable conditions (e.g., more resilient pavements, distributed solar energy to avoid electric grid outages).
- Reversing emission trends will require capitalising on proven solutions. In many cases, it will simply require doing less of what has not been working (e.g., phasing out fossil fuel subsidies) and more of what has been working (e.g., improving fuel economy standards and walking/cycling infrastructure).
B - Expanding and scaling up opportunities
Scaling up opportunities towards lower transport emission trajectories will require significant financing. Globally, achieving low carbon transport pathways will require investments of USD 2.7 trillion per year between 2016 and 2030 (or USD 40.5 trillion in total), with 60-70% of these investments in emerging economies.91 Achieving this level of investment necessitates leveraging private capital as well as support from high-income countries (through direct assistance) and multilateral development banks (through funding frameworks aligned to the Paris Agreement).
- Leveraging COVID-19 recovery packages towards green and equitable transport financing will require building on successful trends during the pandemic (e.g., tactical urbanism measures) and ensuring that positive changes become permanent (e.g., less congestion, improved urban air quality).
- Expanding opportunities for sustainable, low carbon transport will require adopting measures that support the Sustainable Development Goals, such as decent work and economic prosperity, and affordable and clean energy (e.g., electric freight vehicles powered by small-scale renewables).
- Disseminating proven low carbon transport solutions that pay off quickly on social, economic and environmental dimensions (e.g., limiting passenger and freight vehicle imports to reduce operating costs and improve air quality) will require expanding capacity building and education programmes.
- Filling funding gaps will require shifting resources from less efficient to more efficient transport measures that balance incentives and disincentives and drive substantive behaviour change (e.g., expanded road and parking pricing, pay-as-you-drive insurance, incentives for car-free living).
- Expanding lending criteria compatible with Paris Agreement targets will require broader commitments from international financial institutions to incorporate fossil-free financing as a core business practice (e.g., European Investment Bank alignment of transport lending criteria with 1.5 °C targets).

C - Responding to and managing uncertainties
Pandemic recovery packages, which exceeded USD 12 trillion as of October 2020, dwarf existing low carbon investments. A fraction of the investment in these packages could put the world on track to decarbonisation by 2050.92 Building a more stable future for transport systems and societies requires learning and applying lessons from the pandemic involving policy responses and funding mobilisation and increasing investments in low carbon transport to address the umbrella issue of climate change.
- Building more resilient societies will require building transport systems that can adapt to rapid climate impacts and be resilient to shocks, in order to maintain social, physical and mental health (e.g., active and shared mobility systems) under all environmental conditions.
- Recovering from the pandemic and building resilience will require strengthening public transport as a backbone of equitable mobility systems (e.g., for essential workers) and leveraging sustainable freight railways as a critical means of conveyance for personnel and goods (e.g., medical supplies).
- Navigating changing economic conditions will require maintaining accessible and affordable transport systems that facilitate and maintain economic growth and drive more predictable investment patterns (e.g., reduced congestion, increased economic activity in commercial centres).

D - Strengthening and expanding the transport dialogue and community
Establishing strategic collaborations beyond the transport community can help deliver on the Paris Agreement and Sustainable Development Goals. An analysis of personal consumption options has identified low carbon transport choices as the most effective area for reducing emissions, well above shifts in food, housing and other sectors.93 Thus, stakeholders from across many sectors have a common interest in supporting efforts to transform transport and mobility systems, and in turn the social and economic systems they underlie.
- Enhancing the transport community will require strengthening linkages among action by multilateral country groupings (e.g., large and small polluters, the Global North and South), small non-governmental organisations and large corporations (e.g., bringing Google, Apple, Amazon and the transport industry to the same table) and leveraging emerging financing sources (e.g., Bezos Earth Fund supporting electric school bus fleets).
- Broadening the transport community will require engaging additional stakeholders in energy (e.g., planning renewable electricity generation in concert with ZEV demand), the just transition (e.g., enabling cycling jobs that benefit local economies and offer a variety of jobs for a skilled workforce) and social services (e.g., ensuring equitable access to low carbon transport for all ages, genders and abilities).94
- Strengthening the transport community will require demonstrating that radical action can benefit all parties at some level. For instance, ZEV roll-out can benefit producers and consumers (e.g., in manufacturing efficiencies combined with purchase incentives) and government and utilities (e.g., in improved healthcare outcomes combined with energy storage to reduce infrastructure costs).
These building blocks demonstrate that radical action in the transport sector is both an imperative and a possibility. Radical action means empowering both large and small carbon emitters to collaborate in shared solutions and to move beyond more calls for action on transport and climate change. It means moving on to scaling up and accelerating actual on-the-ground actions, which translate to positive impacts for access and mobility that help bridge divides among global regions and income groupings.
Through data-driven analysis, the SLOCAT Transport and Climate Change Global Status Report – 2nd edition demonstrates that rising transport demand and emission trends are avoidable and not inevitable. While 2019 and 2020 have revealed substantive threats to the world in general and to the transport sector in particular, the report shows that these years set the stage to transform a time of uncertainty into a moment of opportunity. Capitalising on this opportunity will create a lasting positive transformation of transport and mobility for the benefit of the climate, people and the planet.
Executive Summary
- Betts (2021), “Met Office: Atmospheric CO2 now hitting 50% higher than pre-industrial levels”, CarbonBrief, 16 March, https://www.carbonbrief.org/met-office-atmospheric-co2-now-hitting-50-higher-than-pre-industrial-levels.
- United Nations Conference on Trade and Development (UNCTAD) (2020), Review of Maritime Transport 2020, New York, https://unctad.org/system/files/official-document/rmt2020_en.pdf.
- International Energy Agency (IEA) (2021), “Global energy review: CO2 emissions in 2020”, 2 March 2021, https://www.iea.org/articles/global-energy-review-co2-emissions-in-2020.
- Crippa et al. (2020), Fossil CO2 Emissions of All World Countries, JRC Science for Policy Report, Publications Office of the European Union, Luxembourg, https://ec.europa.eu/jrc/en/publication/eur-scientific-and-technical-research-reports/fossil-co2-emissions-all-world-countries-2020-report.
- IEA (2019), “Transport sector CO2 emissions by mode in the Sustainable Development Scenario, 2000-2030”, updated 22 November, https://www.iea.org/data-and-statistics/charts/transport-sector-co2-emissions-by-mode-in-the-sustainable-development-scenario-2000-2030.
- Gota et al. (2019), “Decarbonising transport to achieve Paris Agreement targets”, Energy Efficiency, Vol. 12, Springer, pp. 363-86, https://link.springer.com/article/10.1007/s12053-018-9671-3.
- United Nations Environment Programme (UNEP) (2020), Emissions Gap Report 2020, Nairobi, https://www.unep.org/emissions-gap-report-2020.
- Deutsche Gesellschaft für Internationale Zusammenarbeit GmbH (GIZ) and SLOCAT Partnership on Sustainable, Low Carbon Transport, “Tracker of Climate Strategies for Transport”, https://www.changing-transport.org/tracker (accessed 28 May 2021)
- For example, official development assistance from the UK’s Foreign Commonwealth and Development Office dropped from 0.7% to 0.5% of gross national income in 2020, from W. Worley (2020), “Tracking the UK’s controversial aid cuts”, Devex, https://www.devex.com/news/tracking-the-uk-s-controversial-aid-cuts-99883.
- Gota et al., op. cit. note 7.
- SLOCAT (2020), Transport and Voluntary National Reviews 2020, http://slocat.net/wp-content/uploads/2021/02/SLOCAT-2020-VNR-Analysis.pdf.
- SLOCAT, “Transport Knowledge Base”, https://slocat.net/our-work/knowledge-and-research/trakb (accessed 13 May 2021).
- Crippa et al., op. cit. note 4; Gota et al., op. cit. note 7.
- Crippa et al., op. cit. note 4.
- ; European Commission, “Reducing emissions from aviation”, https://ec.europa.eu/clima/policies/transport/aviation_en (accessed 28 May 2021).
- Crippa et al., op. cit. note 4.
- United Nations Framework Convention on Climate Change (UNFCCC) (2020), Publication of Nationally Determined Contribution Synthesis Report, Bonn, https://unfccc.int/sites/default/files/resource/notification_on_ndc_synthesis_2020_ec_2020_306.pdf.
- Gota et al., op. cit. note 7.
- GIZ and SLOCAT, “Summary analysis”, https://www.changing-transport.org/summary-analysis%e2%80%8b (accessed 28 May 2021).
- UNFCCC, “National Adaptation Plans”, https://unfccc.int/topics/adaptation-and-resilience/workstreams/national-adaptation-plans (accessed 15 June 2021); UNFCCC, “National Adaptation Programmes of Action”, https://unfccc.int/topics/resilience/workstreams/national-adaptation-programmes-of-action/introduction (accessed 15 June 2021).
- Oxford Economics (2017), Global Infrastructure Outlook, Global Infrastructure Hub, https://cdn.gihub.org/outlook/live/methodology/Global+Infrastructure+Outlook+-+July+2017.pdf.
- Climate Action Tracker (CAT) (2020), “Global update: Pandemic recovery with just a hint of green”, 23 September, https://climateactiontracker.org/publications/global-update-pandemic-recovery-with-just-a-hint-of-green.
- UNEP (2020), Used Vehicles and the Environment – A Global Overview of Used Light Duty Vehicles: Flow, Scale and Regulation, Nairobi, https://www.unep.org/resources/report/global-trade-used-vehicles-report.
- IEA (2021), Global EV Outlook 2021, https://www.iea.org/reports/global-ev-outlook-2021.
- Gota et al., op. cit. note 7.
- SLOCAT (2021), “E-mobility trends and targets”, https://slocat.net/e-mobility (accessed 28 May 2021).
- Carlin (2021), “The case for fossil fuel divestment”, Forbes, 20 February, https://www.forbes.com/sites/davidcarlin/2021/02/20/the-case-for-fossil-fuel-divestment; J. Lee (2021), “The day the world changed for big oil”, Bloomberg, 30 May, https://www.bloomberg.com/opinion/articles/2021-05-30/exxon-shell-chevron-saw-the-world-change-for-big-oil-emissions.
- Henze (2020), “Battery pack prices cited below $100/kWh for the first time in 2020, while market average sits at $137/kWh”, BloombergNEF, 16 December, https://about.bnef.com/blog/battery-pack-prices-cited-below-100-kwh-for-the-first-time-in-2020-while-market-average-sits-at-137-kwh.
- Cycling Industries Europe (2020), “New European Cycling Industry forecast shows huge growth in bike and e-bike sales”, 2 December, https://cyclingindustries.com/news/details/new-european-cycling-industry-forecast-shows-huge-growth-in-bike-and-e-bike-sales; IEA (2020), Global EV Outlook 2020, Paris, https://www.iea.org/reports/global-ev-outlook-2020.
- International Council on Clean Transportation (ICCT) (2017), Light-duty Vehicle Greenhouse Gas and Fuel Economy, 2017 Global Update, Washington, D.C., https://theicct.org/sites/default/files/publications/2017-Global-LDV-Standards-Update_ICCT-Report_23062017_vF.pdf; IEA (2019), Fuel Economy in Major Car Markets: Technology and Policy Drivers 2005-2017, Global Fuel Economy Initiative, London, https://www.globalfueleconomy.org/media/708177/gfei-wp19.pdf.
- UNEP, op. cit. note 27.
- SLOCAT (2021), “SLOCAT quick wins on transport, sustainable development and climate change”, https://slocat.net/quick-wins; T. Combs, “Local actions to support walking and cycling during social distancing dataset”, Pedestrian and Bicycle Information Center, http://pedbikeinfo.org/resources/resources_details.cfm?id=5209 (accessed 29 September 2020).
- European Cyclists’ Federation (ECF), “COVID-19 Cycling Measures Tracker”, https://ecf.com/dashboard (accessed 20 May 2021).
- Venter, A. Mahendra and D. Hidalgo (2019), From Mobility to Access for All: Expanding Urban Transportation Choices in the Global South, World Resources Institute, Washington, D.C., https://files.wri.org/s3fs-public/from-mobility-to-access-for-all.pdf.
- World Bank (2006), “Rural Access Index”, Washington, D.C. Data are currently being updated for 2020.
- International Civil Aviation Organization (2019), The World of Air Transport in 2019, Montreal, https://www.icao.int/annual-report-2019/Pages/the-world-of-air-transport-in-2019.aspx; Crippa et al., op. cit. note 4; CAT (2020), “International aviation”, https://climateactiontracker.org/sectors/aviation.
- ICLEI–Local Governments for Sustainability, “What is urban freight”, https://drive.google.com/file/d/1_M0HfPWK-comVK9KgNbsOT-O-BEtfJ24/view (accessed 28 September 2020).
- CAT, op. cit. note 41.
- Cooper (2020), “Delta Air Lines invests $1 billion in cutting carbon emissions”, Climate Action, 18 February, https://www.climateaction.org/news/delta-air-lines-invests-1-billion-in-cutting-carbon-emissions; B. Kollmeyer (2019), “EasyJet’s carbon-free pledge may win more green-conscious fliers”, Market Watch, 19 November, https://www.marketwatch.com/story/easyjets-carbon-free-pledge-may-win-more-green-conscious-fliers-2019-11-19; D. Holger (2019), “Lufthansa passengers can offset travel with green aviation fuel”, Market Watch, 14 November, https://www.marketwatch.com/story/lufthansa-passengers-can-offset-travel-with-green-aviation-fuel-2019-11-14.
- Seoul Metropolitan Government, “Seoul bikesharing usage”, http://data.seoul.go.kr/dataList/OA-14994/F/1/datasetView.do (accessed 20 March 2021).
- TNMT, “The environmental impact of today’s transport types”, https://tnmt.com/infographics/carbon-emissions-by-transport-type (accessed 25 May 2021); Asian Development Bank and GIZ (2011), Changing Course in Urban Transport, https://www.sutp.org/files/contents/documents/resources/J_Others/GIZ_SUTP_changing-course-urban-transport-illustrated-guide.pdf; H. Nguyen, F. Montgomery and P. Timms, “Should motorcycle be blamed for traffic congestion in Vietnamese cities?” CODATU, http://www.codatu.org/wp-content/uploads/Should-motorcycle-be-blamed-for-traffic-congestion-in-vietnamese-cities-Hien-NGUYEN-Franck-MONTGOMERY-Paul-TIMMS.pdf; Transformative Urban Mobility Initiative (TUMI), “Passenger capacity of different transport modes”, https://www.transformative-mobility.org/assets/publications/Passenger-Capacity-of-different-Transport-Modes.pdf (accessed 25 May 2021).
- ECF, op. cit. note 37.
- Oortwijn (2019), “Giant to sell 600,000 e-bikes this year”, Bike-EU, 17 October, https://www.bike-eu.com/home/nieuws/2019/10/giant-to-sell-600000-e-bikes-this-year-10136791; Bike-EU (2020), “Taiwan’s 2019 e-bike exports exceeds all expectations”, 3 June, https://www.bike-eu.com/sales-trends/nieuws/2020/06/taiwans-2019-e-bike-exports-exceeds-all-expectations-10137981; P. Lee et al. (2019), Technology, Media, and Telecommunications Predictions 2020, Deloitte Development LLC, https://www2.deloitte.com/content/dam/insights/us/articles/722835_tmt-predictions-2020/DI_TMT-Prediction-2020.pdf; J. Oortwijn (2020), “2019 brings undiminished high demand for e-bikes in Holland”, Bike-EU, 21 January, https://www.bike-eu.com/market/nieuws/2020/01/2019-brings-undiminished-high-demand-for-e-bikes-in-holland-10137216.
- Lee et al., op. cit. note 48.
- ICLEI, op. cit. note 42; International Transport Forum (ITF) (2021), ITF Transport Outlook 2021, Paris, https://www.oecd-ilibrary.org/sites/16826a30-en/1/3/2/index.html?itemId=/content/publication/16826a30-en&_csp_=190cc6434d2fccf11e2098c12744cdb5&itemIGO=oecd&itemContentType=book.
- Climate Works, “Drive Electric Campaign”, https://www.driveelectriccampaign.org (accessed 25 May 2021).
- ICLEI, op. cit. note 42; ITF, op. cit. note 50.
- Deutsche Post DHL Group (2017), “Zero emissions by 2050: DHL announces ambitious new environmental protection target”, https://www.dhl.com/global-en/home/about-us/delivered-magazine/articles/2017/issue-2-2017/zero-emissions-by-2050.html.
- UN (2021), “Global e-commerce jumps to $26.7 trillion, fuelled by COVID-19”, 3 May, https://news.un.org/en/story/2021/05/1091182.
- UNCTAD, op. cit. note 2.
- UN Women (2019), “UN Commission on the Status of Women delivers roadmap on ensuring women’s social protection, mobility, safety, and access to economic opportunities”, 22 March, https://www.unwomen.org/en/news/stories/2019/3/press-release-csw-63-delivers-roadmap-on-ensuring-womens-social-protection.
- Tobin (2017), “Gender equality: What causes gender gaps in the labour market?” International Labour Organization, 1 August, https://www.ilo.org/global/about-the-ilo/newsroom/news/WCMS_566891/lang–en/index.htm.
- UN (2019), “Report of the Commission on the Status of Women, Report on the sixty-third session (23 March 2018 and 11–22 March 2019)”, Economic and Social Council, Official Records 2019, Supplement No. 7, https://undocs.org/pdf?symbol=en/E/2019/27.
- C40 (2019), Gender Inclusive Climate Actions in Cities: How Women’s Leadership and Expertise Can Shape Sustainable and Inclusive Cities, London, ; ITF (2018), Women’s Safety and Security: A Public Transport Priority, Organisation for Economic Co-operation and Development (OECD), Paris, https://www.itf-oecd.org/sites/default/files/docs/womens-safety-security_0.pdf.
- ITF, op. cit. note 50.
- IEA (2019), The Future of Rail, Paris, https://www.iea.org/reports/the-future-of-rail.
- World Bank, “Rural population (% of total population)”, https://data.worldbank.org/indicator/SP.RUR.TOTL.ZS (accessed 1 June 2021); World Health Organization (WHO) (2018), Global Status Report on Road Safety 2018, Geneva, https://www.who.int/publications/i/item/9789241565684.
- Bouman et al. (2017), “State-of-the-art technologies, measures, and potential for reducing GHG emissions from shipping – a review”, Transportation Research Part D: Transport and Environment, Vol. 52, Elsevier Ltd, pp. 408-21, https://doi.org/10.1016/j.trd.2017.03.022.
- UNCTAD, op. cit. note 2.
- IEA (2020), Energy Technology Perspectives 2020, Paris, https://www.iea.org/reports/energy-technology-perspectives-2020.
- Mazzino et al. (2017), Rail 2050 Vision, European Rail Research Advisory Council, Brussels, https://www.ptferroviaria.es/docs/Documentos/122017_ERRAC%20RAIL%202050.pdf; K. G. Logan, J. D. Nelson and A. Hastings (2020), “Electric and hydrogen buses: Shifting from conventionally fuelled cars in the UK”, Transportation Research Part D: Transport and Environment, Vol. 85, Elsevier Ltd, https://doi.org/10.1016/j.trd.2020.102350.
- Schwandl (2004), “Africa”, Urbanrail.net, http://www.urbanrail.net/af/africa.htm (accessed 24 May 2021).
- Salvador Prefeitura, “BRT Salvador”, http://brt.salvador.ba.gov.br/#4 (accessed 24 May 2021); L. Carboni and M. Marin (2019), “Tanéo victim de son succès”, France TV, 18 October, https://la1ere.francetvinfo.fr/nouvellecaledonie/taneo-victime-son-succes-761595.html; F. Cotter (2019), “Iveco Crealis key to New Caledonia bus rapid transit network”, Australasian Bus and Coach, 12 September, https://www.busnews.com.au/industry-news/1912/iveco-crealis-key-to-new-caledonia-bus-rapid-transit-network; Wikipedia, “TransPeshawar”, https://en.wikipedia.org/wiki/TransPeshawar (accessed 24 May 2021); Global BRT Data, “Year system commenced”,
- https://brtdata.org/indicators/systems/year_system_commenced (accessed 24 May 2021); R. Rudick (2020), “Oakland BRT line opens”, StreetsBlog SF, 7 August, https://sf.streetsblog.org/2020/08/07/oakland-brt-line-opens-sunday.
- SLOCAT, “Informal transport”, global Transport Knowledge Partnership, International Road Federation, https://www.gtkp.com/themepage.php&themepgid=467 (accessed 9 April 2021).
- Renewable Energy Policy Network for the 21st Century (REN21) and Fia Foundation (2020), Decarbonising the Transport Sector with Renewables Requires Urgent Action, Paris, https://www.ren21.net/wp-content/uploads/2019/05/REN21_FIA-Fdn_Renewable-Energy-Pathways_FINAL.pdf.
- IEA, World Energy Statistics and Balances, 2019 edition (Paris: 2019).
- IEA, op. cit. note 65.
- Shaheen and A. Cohen (2020), Innovative Mobility: Carsharing Outlook – Carsharing Market Overview, Analysis, and Trends, https://escholarship.org/uc/item/61q03282; R. Meddin et al., “The Meddin Bike-sharing World Map”, https://bikesharingworldmap.com (accessed 8 October 2020); B. Welle and T. Fried (2019), “Tech startups offer new answers to African transport woes. How can cities capitalize?” TheCityFix, 14 November, https://thecityfix.com/blog/tech-startups-offer-new-answers-african-transport-woes-can-cities-capitalize-ben-welle-travis-fried.
- Kelley (2021), “Micromobility is thriving in the new ‘safety economy’”, MarshMcLennan, 17 March, https://www.brinknews.com/how-bicycle-and-scooter-sharing-are-likely-to-thrive-in-a-new-safety-coronavirus-economy; The Strait Times (2020), “Food delivery overtakes ride-hailing as Grab’s biggest business in Covid-19 crisis”, 14 August, https://www.straitstimes.com/business/companies-markets/covid-19-delivers-to-grab-its-first-crisis-lessons.
- Lime (2019), “E-scooters and Earth Day: Measuring micromobility’s impact on the environment”, 22 April, https://www.li.me/second-street/e-scooters-earth-day-measuring-micromobility-impact-environment; A. Henao and W. E. Marshall (2019), “The impact of ride-hailing on vehicle miles traveled”, Transportation, Vol. 46/6, Springer, pp. 2173-94, https://doi.org/10.1007/s11116-018-9923-2.
- Rupprecht et al. (2013), “Decision makers summary for developing and implementing a sustainable urban mobility plan”, https://www.eltis.org/sites/default/files/sump_decision_makers_summary_interactive_high.pdf.
- SLOCAT, op. cit. note 13.
- UN-Habitat (2013), “Chapter 2: The State of Urban Transport”, in Planning and Design for Sustainable Urban Mobility: Global Report on Human Settlements 2013, Routledge, New York, https://unhabitat.org/sites/default/files/download-manager-files/Planning%20and%20Design%20for%20Sustainable%20Urban%20Mobility.pdf.
-
- Neves and C. Brand (2019), “Assessing the potential for carbon emissions savings from replacing short car trips with walking and cycling using a mixed GPS-travel diary approach”, Transportation Research Part A: Policy and Practice, Vol. 123, Elsevier Ltd, pp. 130-46, https://doi.org/10.1016/j.tra.2018.08.022; D. P. Piatkowski, K. J. Krizek and S. L. Handy (2015), “Accounting for the short term substitution effects of walking and cycling in sustainable transportation”, Travel Behaviour and Society, Vol. 2/1, Elsevier Ltd, pp. 32-41, https://doi.org/10.1016/j.tbs.2014.07.004.
- WHO, op. cit. note 62.
- Combs, op. cit. note 36.
- Northwestern University (2019), “Electric vehicle adoption improves air quality and climate outlook”, Science Daily, 12 April, https://www.sciencedaily.com/releases/2019/04/190412122912.htm.
- IEA (2021), “Trends and developments in electric vehicle markets”, https://www.iea.org/reports/global-ev-outlook-2021/trends-and-developments-in-electric-vehicle-markets; IEA, op. cit. note 33.
- UNEP, op. cit. note 27.
- O’Callaghan and E. Murdock (2021), Are We Building Back Better? UNEP, Nairobi, https://wedocs.unep.org/bitstream/handle/20.500.11822/35281/AWBBB.pdf.
- Gota et al., op. cit. note 7.
- CAT (2021), “CAT Climate Target Update Tracker”, 19 May, https://climateactiontracker.org/climate-target-update-tracker; CAT (2021), “The CAT Thermometer”, 4 May, https://climateactiontracker.org/global/cat-thermometer.
- Crippa et al., op. cit. note 4.
- OECD (2017), Investing in Climate, Investing in Growth, Paris, https://doi.org/10.1787/9789264273528-en.
- Andrijevic et al. (2020), “COVID-19 recovery funds dwarf clean energy investment needs”, Science, Vol. 370/6514, American Association for the Advancement of Science, pp. 298-300, https://science.sciencemag.org/content/370/6514/298.
- Ivanova et al. (2020), “Quantifying the potential for climate change mitigation of consumption options”, Environmental Research Letters, Vol. 15, IOP Science Publishing, https://iopscience.iop.org/article/10.1088/1748-9326/ab8589.
- ECF, “Support the European Cyclists’ Federation”, https://ecf.com/what-we-do/cycling-economy/jobs-and-job-creation-european-cycling-sector (accessed 27 May 2021).