Sustainable Mobility Planning and Transport Demand Management
As transport demand and emissions continue to rise worldwide, countries and cities have responded by using sustainable mobility planning and transport demand management to improve transport planning and to provide enhanced access to mobility options. Sustainable mobility planning is a broad strategy that helps to improve access to mobility while achieving other goals, such as reducing emissions and lowering traffic fatalities. Transport demand management refers to diverse transport and land-use planning tactics that result in more efficient use of transport and spatial resources.i Both approaches focus on ensuring access to opportunities, services and goods rather than simply trying to move vehicles.
A number of frameworks exist to help implement these strategies. Sustainable urban mobility plans (SUMPs), for example are strategic frameworks designed at the local level to improve citizens’ overall quality of life by addressing major challenges related to urban transport.iii National urban mobility policies and investment programmes (NUMPs) refer to national strategic frameworks to enhance the capabilities of cities to fulfil their mobility needs in a sustainable way.
Other valuable planning approaches include: transit-oriented development, which intends to integrate people, activities, buildings and public spaces in designed urban places; low -and ultra-low emission zones, which are areas where access for more-polluting vehicles is restricted; and road pricing, which refers to variable road tolls intended to reduce peak-period traffic volumes to optimal levels. In this discussion, the term “vehicle restrictions” summarises measures put in place to limit the number of vehicles entering a city and/or measures limiting the ownership of private vehicles.
Key Findings
-
Demand trends
Traffic congestion increased in 57% of cities worldwide between 2018 and 2019, while only 15% of cities recorded reductions in congestion.
The global average price of petrol rose 17% between 2017 and 2019, while the price of diesel rose 25%; however, fuel prices remained below market value in 53 countries in 2019, contributing to increased demand for motorised travel.
Average parking prices increased 5% between 2017 and 2019 in cities with the highest parking fees worldwide.
Table 1.
Top 10 cities with the most expensive parking, 2017 and 2019
City
2017
2019
Change
City
2017
2019
Change
City
2017
2019
Change
City
2017
2019
Change
City
2017
2019
Change
City
2017
2019
Change
City
2017
2019
Change
City
2017
2019
Change
City
2017
2019
Change
City
2017
2019
Change
City
2017
2019
Change
Note: Based on the average price for two hours of off-street parking, measured in USD using purchasing power parity.
Teleworking can help reduce transport demand and congestion; however, this potential varies widely, with remote work available to only 13% of workers in developing countries based on a 2020 study.
-
Emission trends
Deployment of low-emission zones has helped to greatly reduce emissions of carbon dioxide (CO2) and nitrogen dioxide and has yielded measurable improvements in road safety and public health.
Research on road pricing indicates that it has significant potential to reduce motorised travel demand, traffic congestion, and carbon emissions, but examples of implementation remain limited.
Figure 1.
Potential impacts of congestion charging in three cities in Latin America and the Caribbean
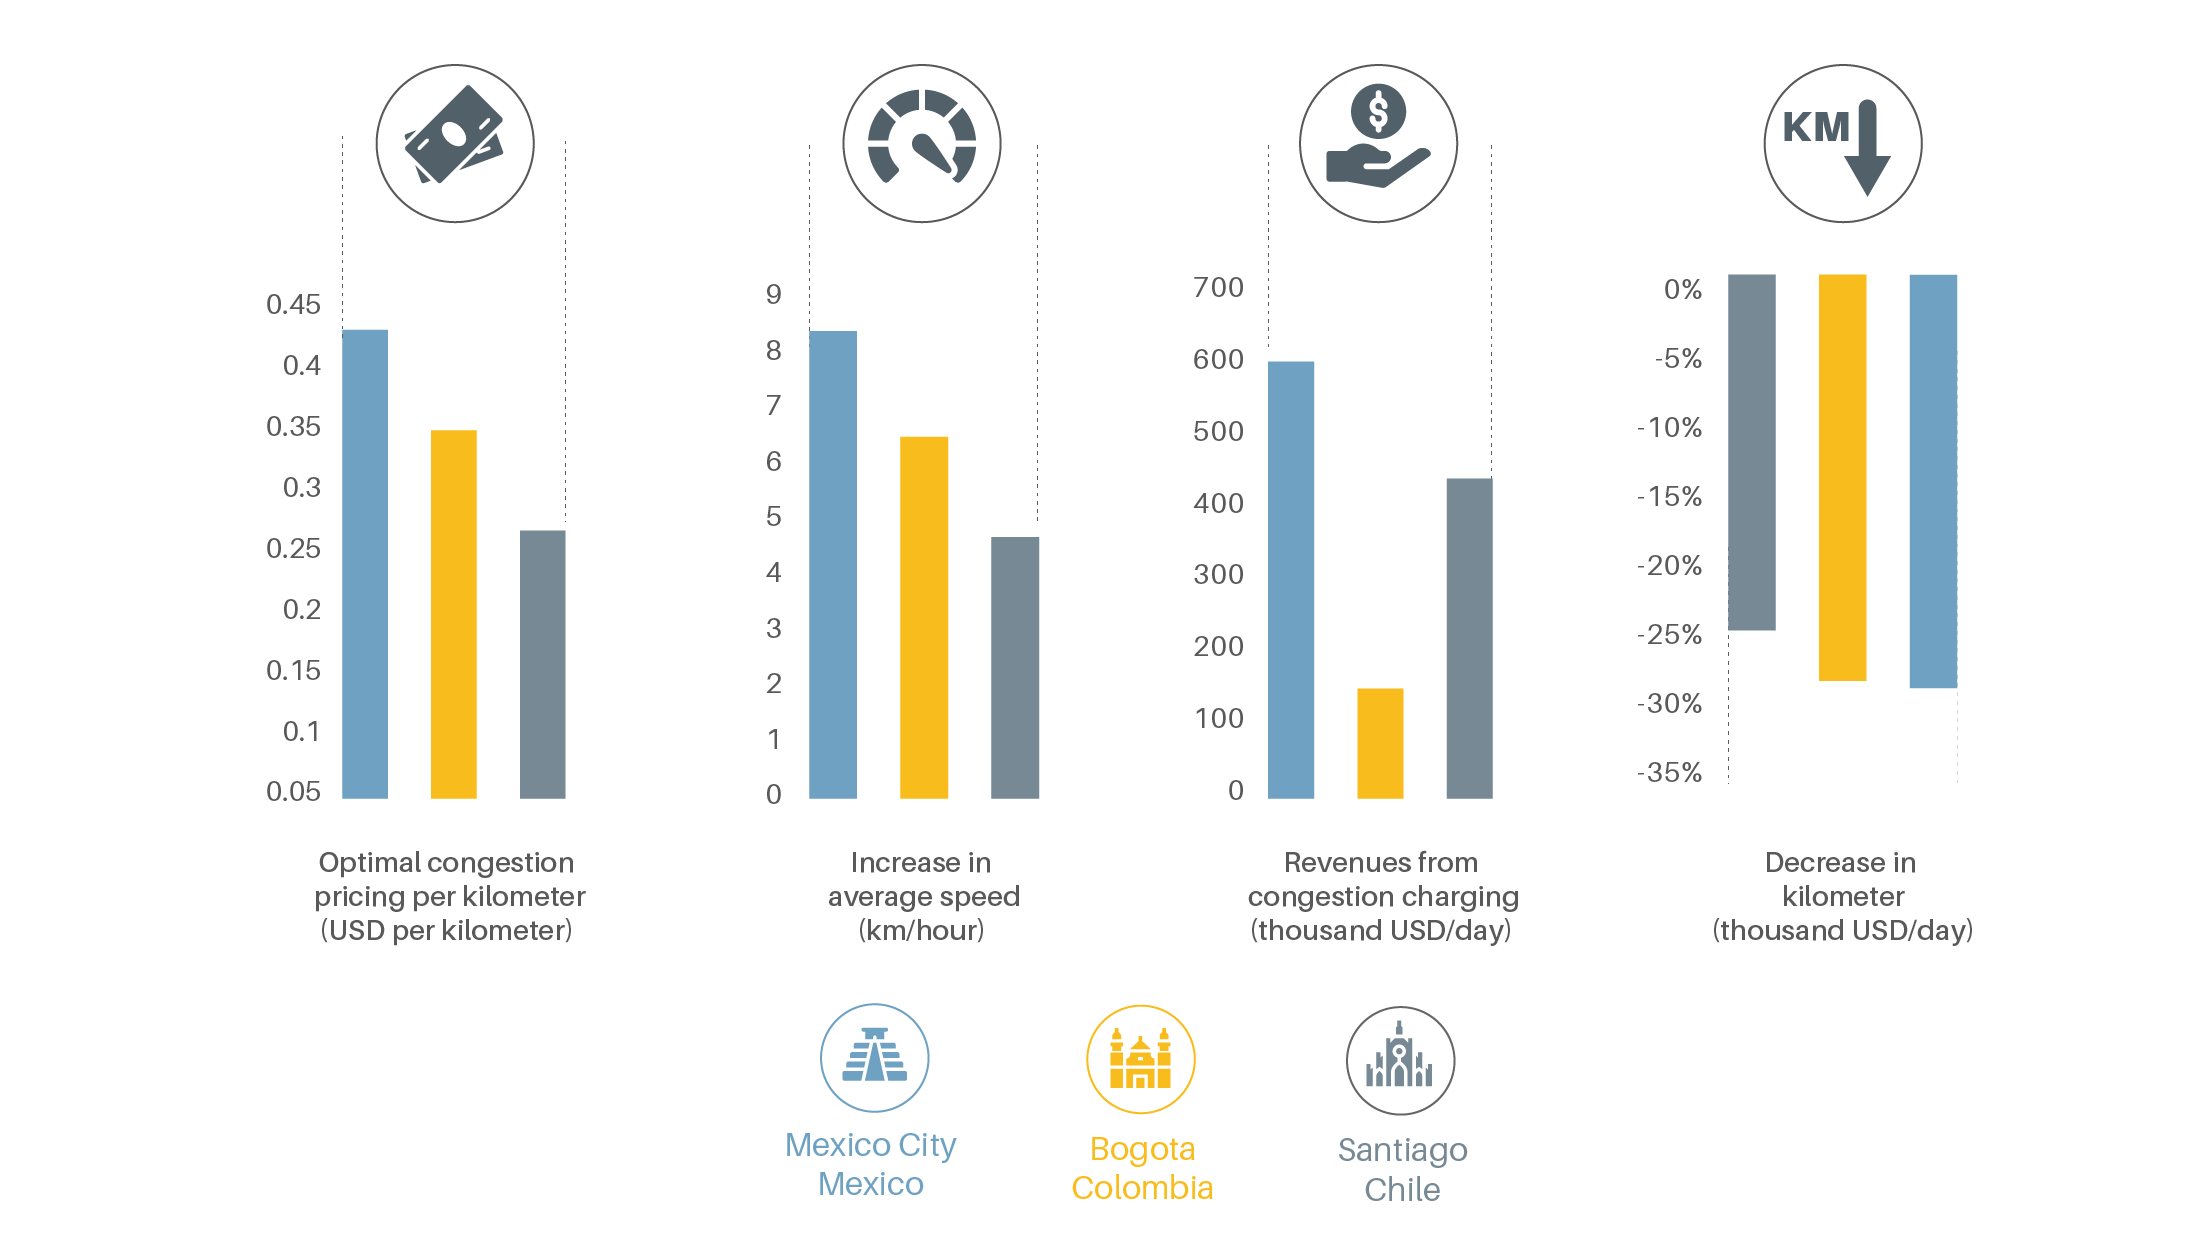
A study on the potential impact of road pricing in Bogota, Colombia; Mexico City, Mexico; and Santiago, Chile identified a 25-29% reduction in vehicle-kilometres travelled, less congestion and revenues of USD 100,000 to USD 600,000 per day
-
Policy Measures
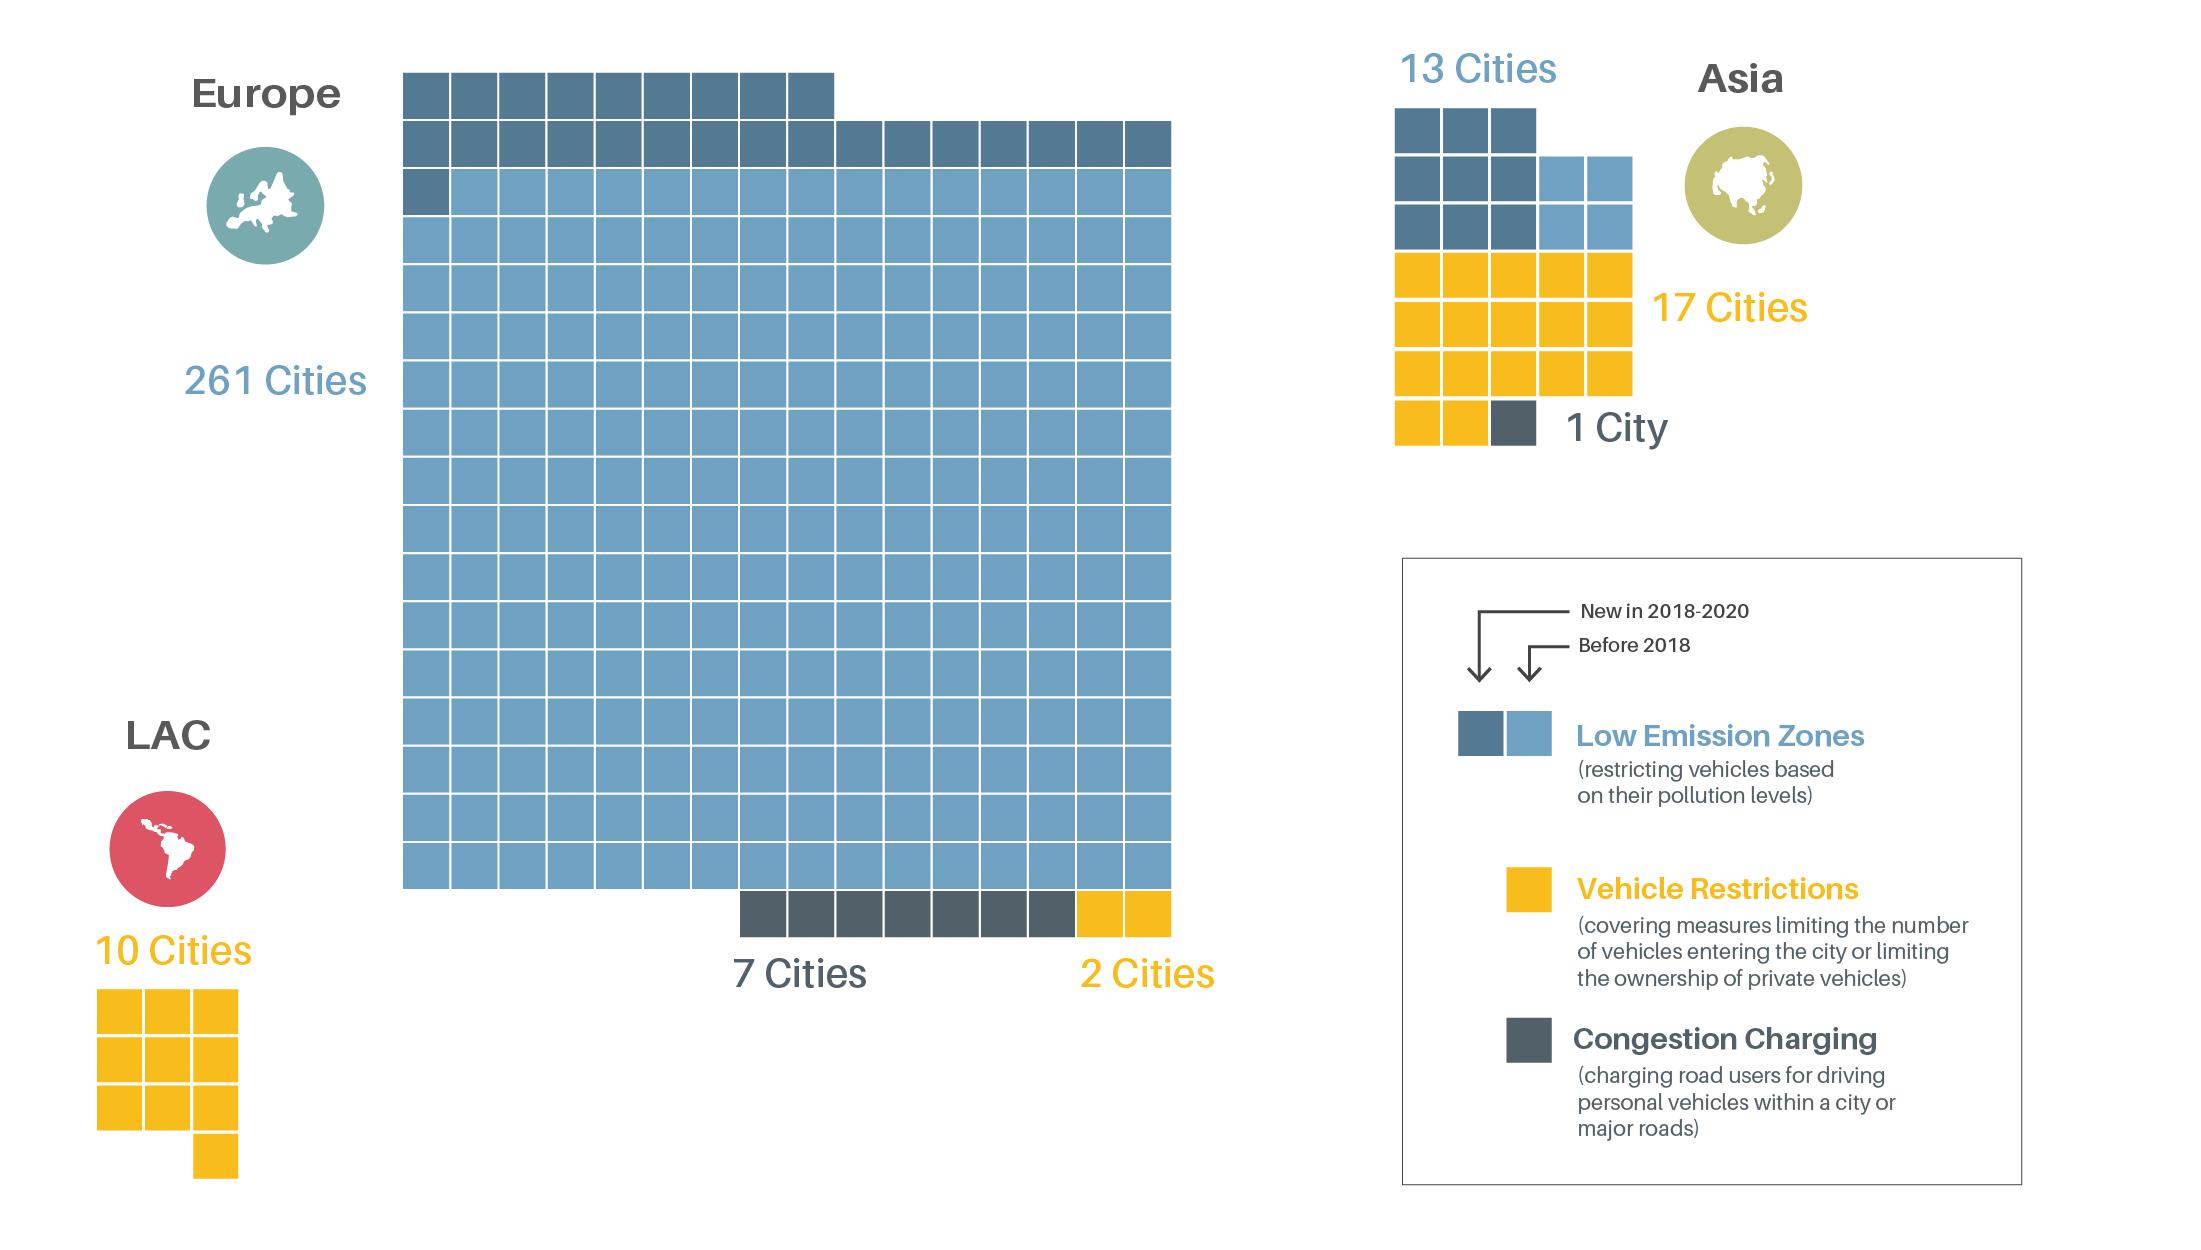
During 2018-2020, cities around the world prioritised low-emission zones among strategies for transport demand management, whereas vehicle restrictions and congestion charging remained unchanged.
Figure 2.
Overview of transport demand measures in 2019 and 2020
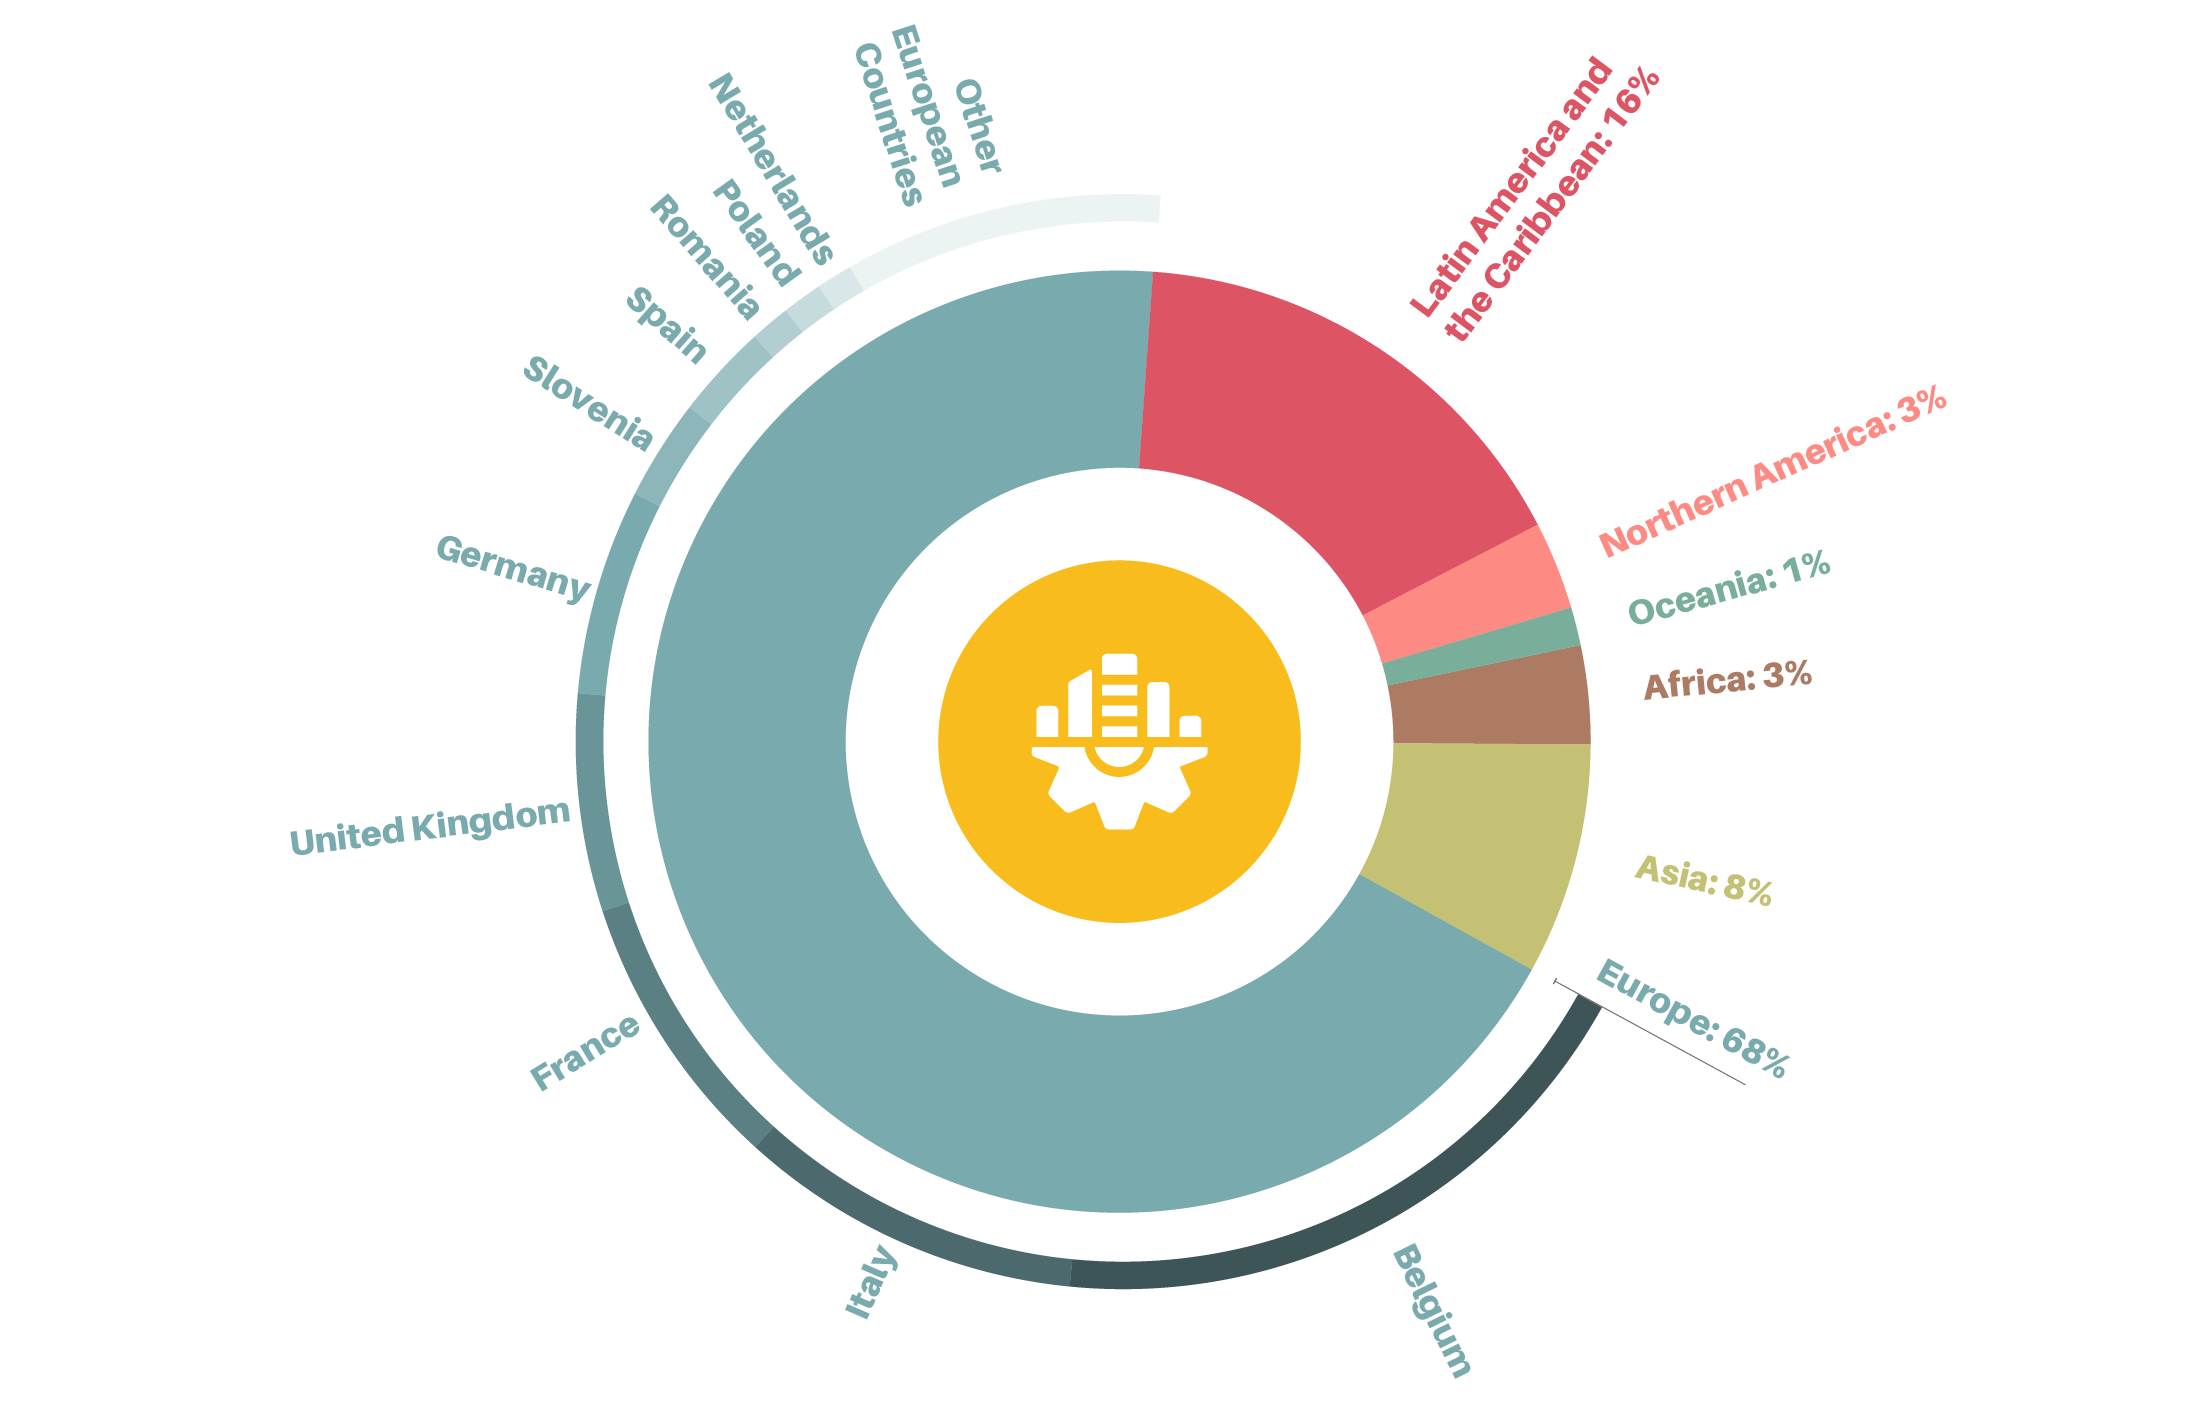
More than two-thirds of sustainable urban mobility plans (SUMPs) were found in European cities in 2018, but SUMPs have expanded greatly in Africa and in Latin America and the Caribbean since then.
Figure 3.
Sustainable urban mobility plans in Europe versus other regions, 2020
“Complete streets” programmes are contributing to social inclusion and equity through specific sustainability-related parameters.
Planning concepts that prioritise proximity (such as the “15-minute city”) and land-use planning guidance are growing in prominence, supporting increased and more equitable access to economic and social needs in cities around the world.
-
Impacts of the COVID-19 pandemic
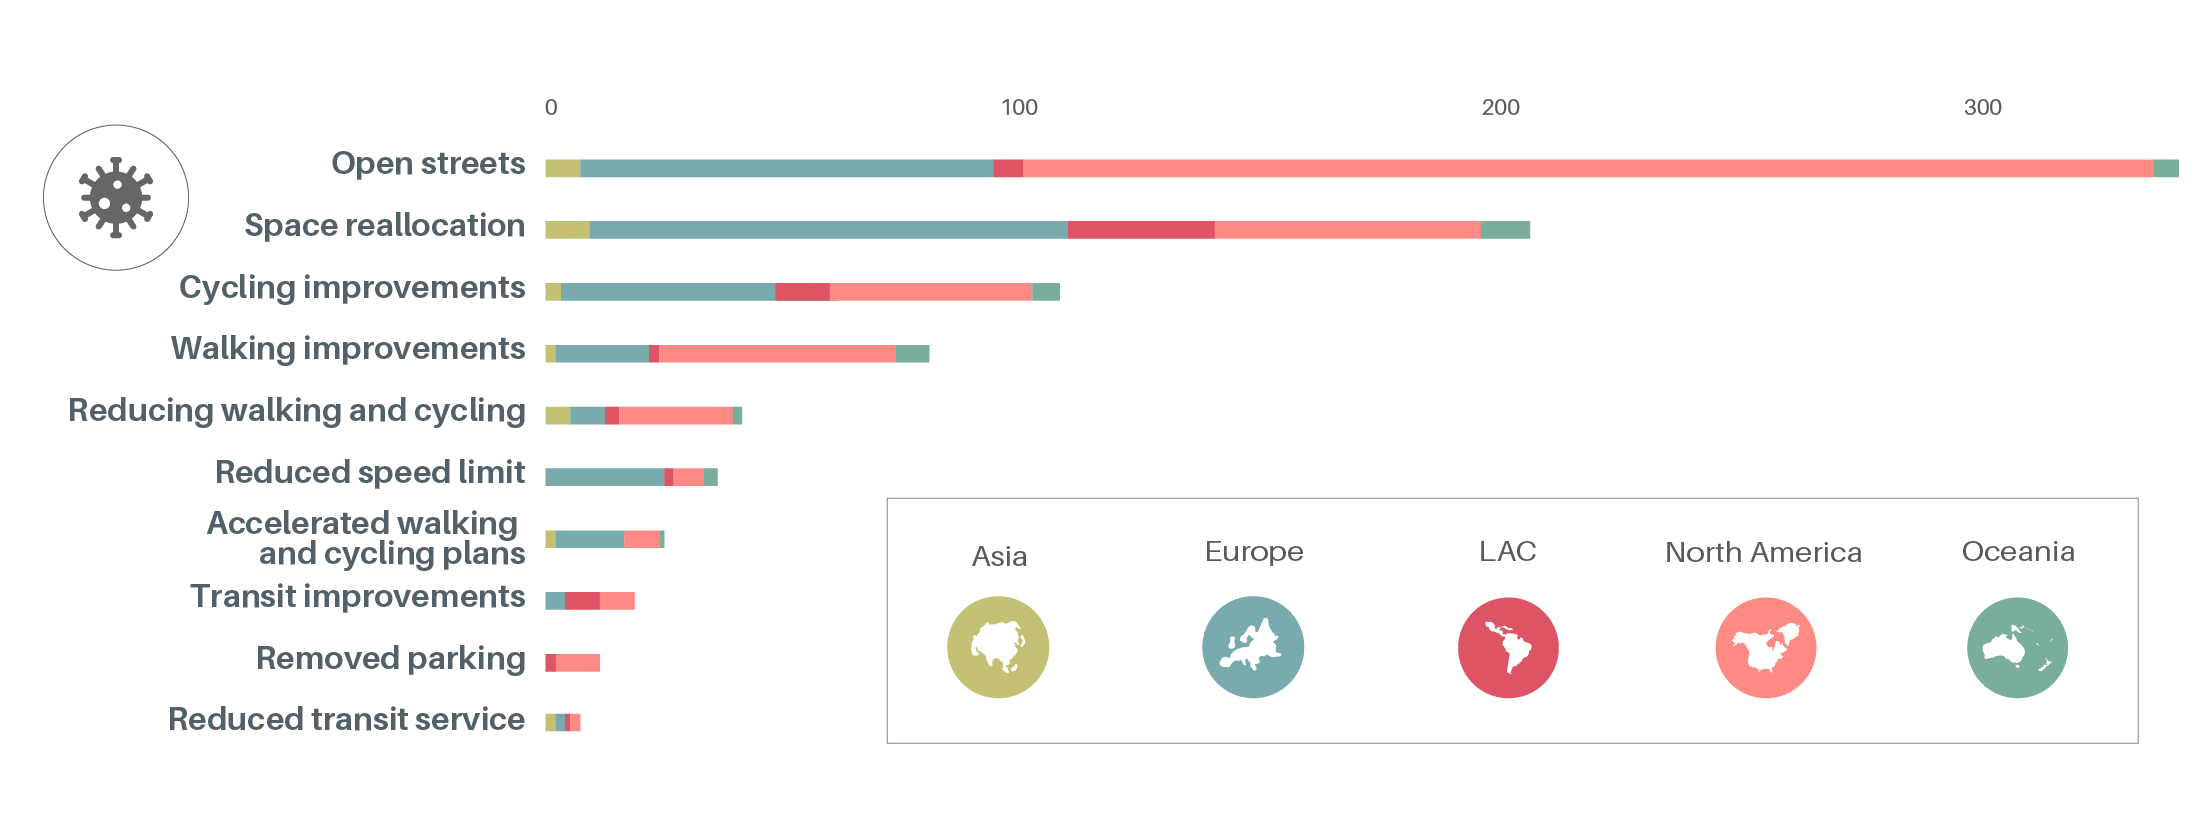
Responses to the pandemic have encompassed a wide range of measures to enable social distancing, help people avoid unnecessary trips and spread out travel during periods of peak demand.
Figure 4.
Responses to manage travel demand during the COVID-19 pandemic, by region, 2020
COVID-19 caused major disruptions to both urban public transport and commercial real estate in 2020, creating uncertainty for investments in transit-oriented development in the near term.
Automobile use and sales declined during the pandemic, creating the potential for changing patterns of motorised travel in the medium to long term.
Key indicators
2017*
2019/2020*
% change
Key indicators
2017*
2019/2020*
% change
Key indicators
2017*
2019/2020*
% change
Key indicators
2017*
2019/2020*
% change
Key indicators
2017*
2019/2020*
% change
Key indicators
2017*
2019/2020*
% change
Key indicators
2017*
2019/2020*
% change
Key indicators
2017*
2019/2020*
% change
(*) Data are for the indicated year unless noted otherwise.
