North America
Regional Overview
Population size
(2020)
Population growth
(2010-2020)
%
GDP growth
(2010-2019)
%
Total vehicle sales
growth (2010-2019)
%
Total transport CO2
emissions (2019)
Share of global transport
CO2 emissions (2019)
%
North America – comprising Bermuda (territory of the United Kingdom), Canada, Greenland (Denmark), Saint Pierre and Miquelon (France) and the United States of America (USA) – contributed the second highest regional share of transport CO2 emissions in 2019 after Asia, at 29%. This reflects the continued use of private vehicles in countries that have limited fuel economy standards (especially the USA), as well as the temporary USA withdrawal from the Paris Agreement. Both the USA and Canadian Nationally Determined Contributions towards reducing emissions under the Paris Agreement have been deemed “critically insufficient” or “insufficient” to meet targets.
Steps towards decarbonisation of the region’s transport sector included growing local, state and provincial leadership on transport climate action, increased momentum towards the electrification of medium- and heavy-duty vehicles, and innovations in shared mobility. In June 2020, the INVEST in America Act was proposed to improve USA infrastructure, including in the transport sector.
The COVID-19 pandemic led to sharp declines in public transport demand across the region. In March 2020, a recovery package announced in the USA allocated USD 25 billion in federal aid to public transport, and a Canadian recovery plan provided significant funding to the country’s airports but few incentives for sustainable transport.
Key Findings
-
Demand Trends
In the USA in 2019, single-occupancy vehicles accounted for more than 75% of work commute trips, whereas public transport accounted for less than 5%, with little change from 2018.
Rail accounted for roughly one-third of all freight transport in Canada in 2011, and in the USA in 2019, exceeded only by pipelines in Canada (40%) and trucking in the USA (39%).
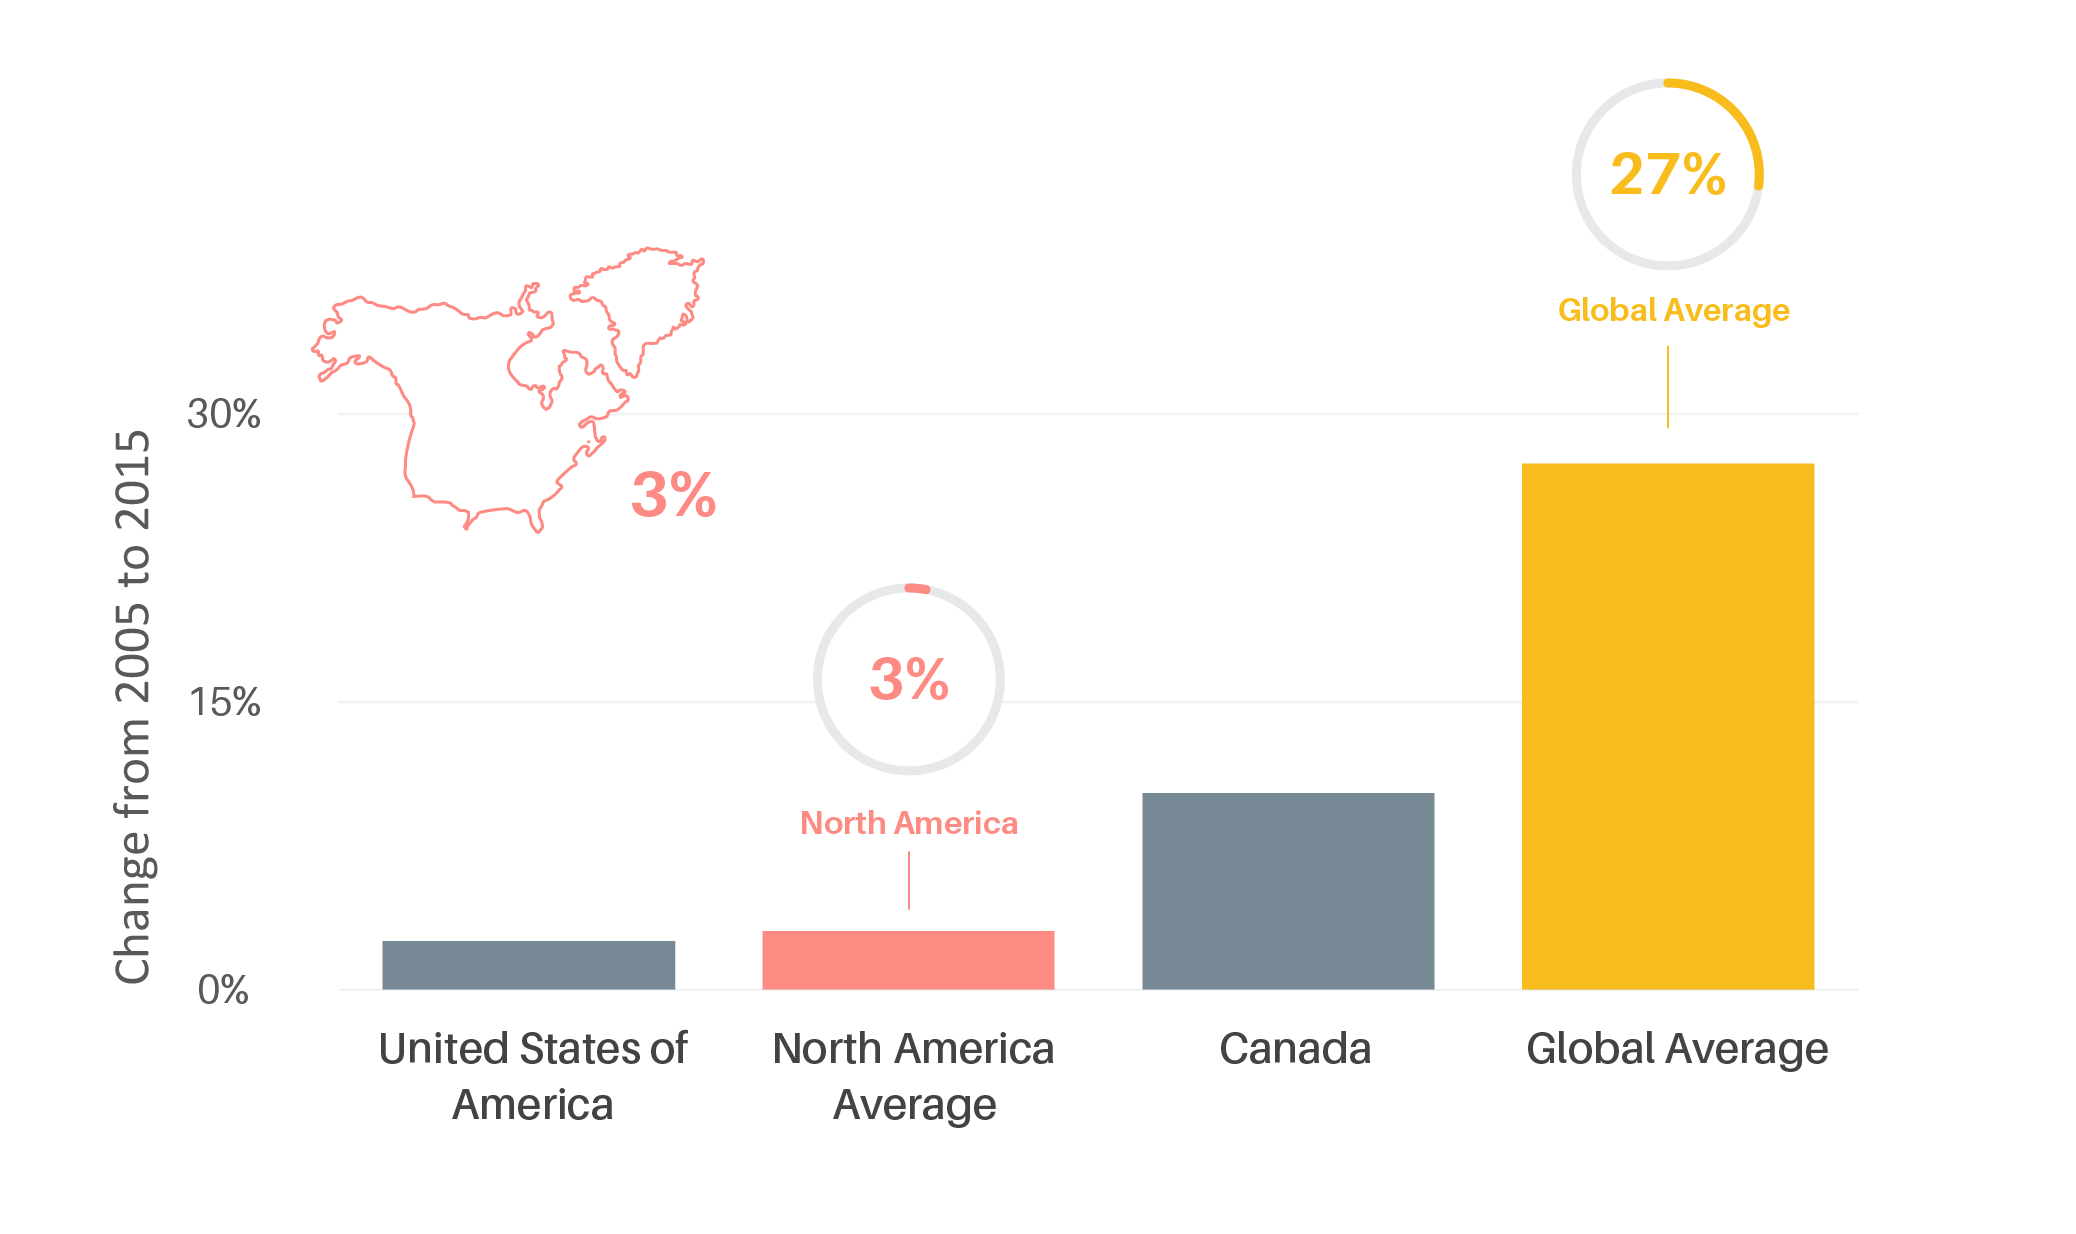
Car ownership levels in North America were nearly five times the global average in 2015; however, the average growth in car ownership between 2005 and 2015 was nine times greater globally than in North America.
Figure 1.
Car ownership rates per 1,000 people in North America, 2015
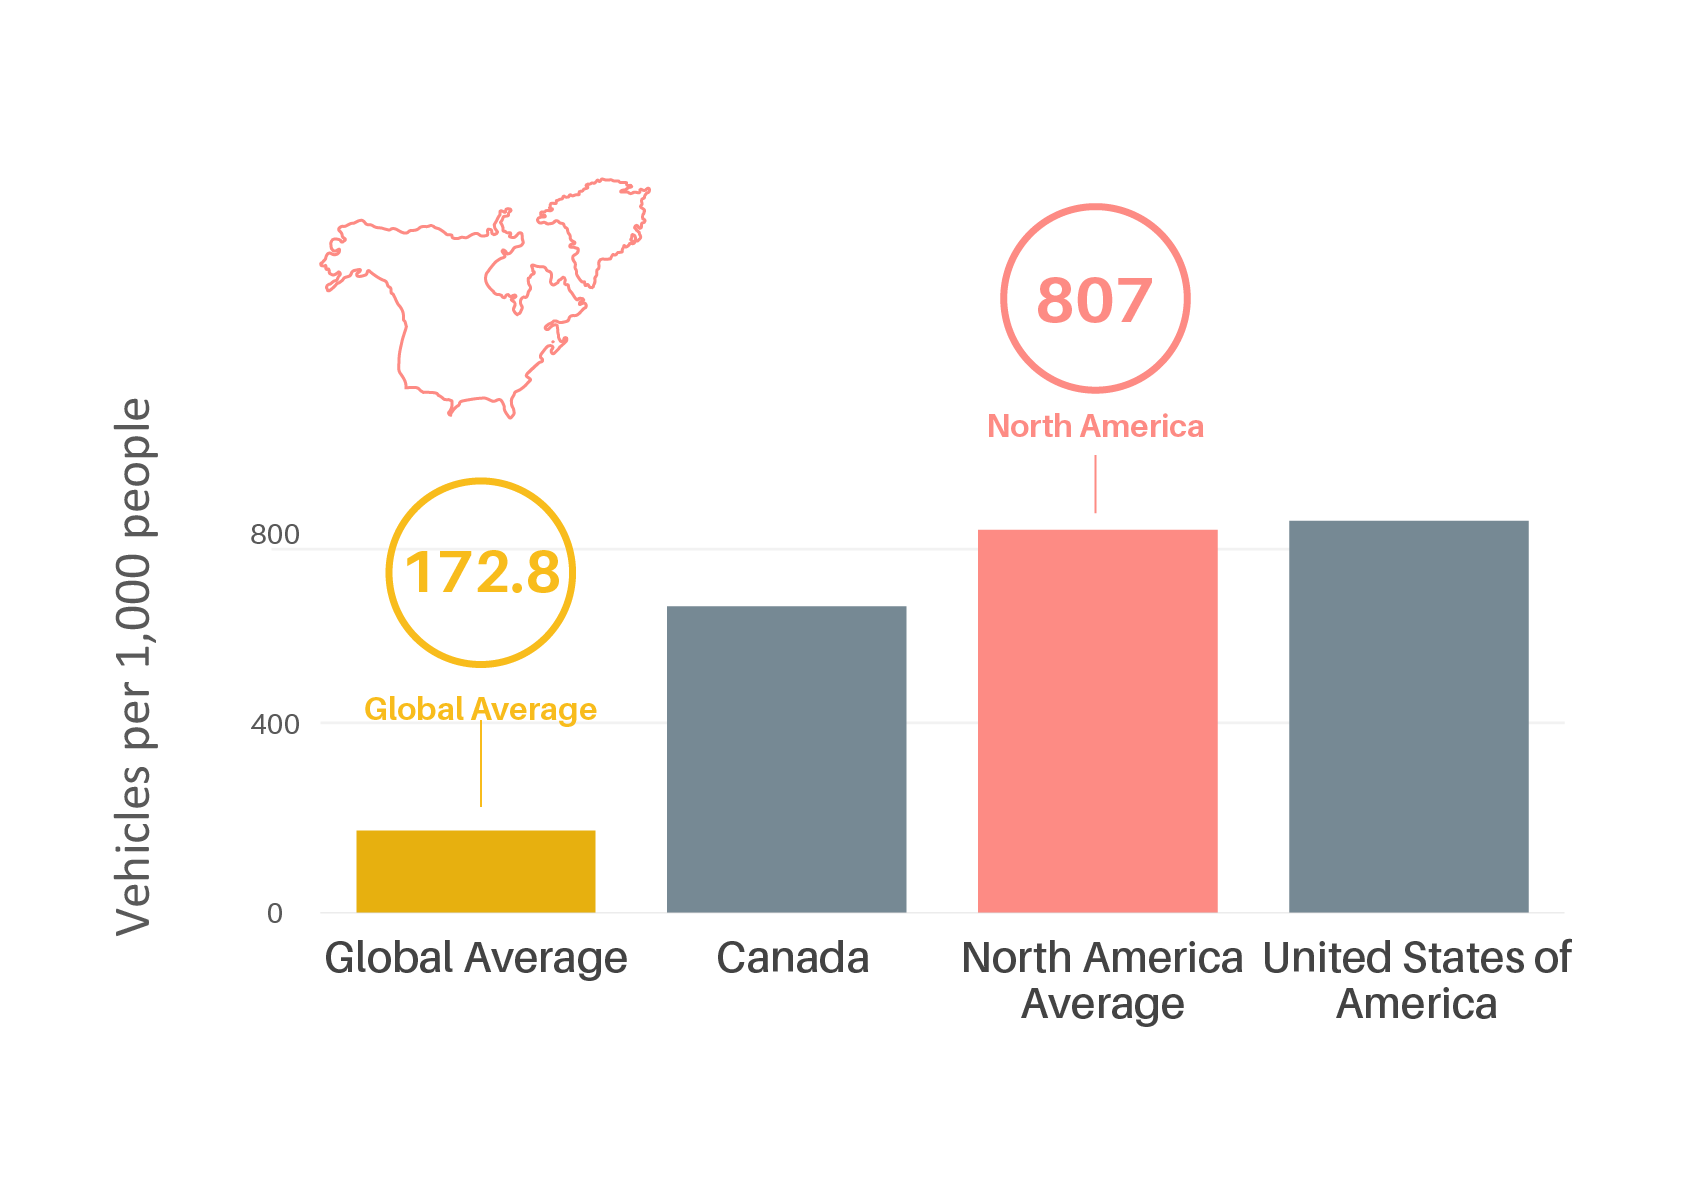
Figure 2.
Growth in car ownership in North America, 2005-2015
Total new vehicle sales in North America grew 46% in 2019, the highest increase among global regions and nearly 3.5 times the increase in Europe (13%).
The USA is the world’s second largest national market for electric and plug-in hybrid cars (after China), with nearly 1.5 million units sold in 2019; however, electric vehicles accounted for only around 2% of new car sales in the USA that year.
-
Emission Trends
Transport carbon dioxide (CO2) emissions in North America grew 6% from 2010 to 2019, less than half the global average rate.
Figure 3.
Change in transport CO2 emissions in North America, 2010-2019
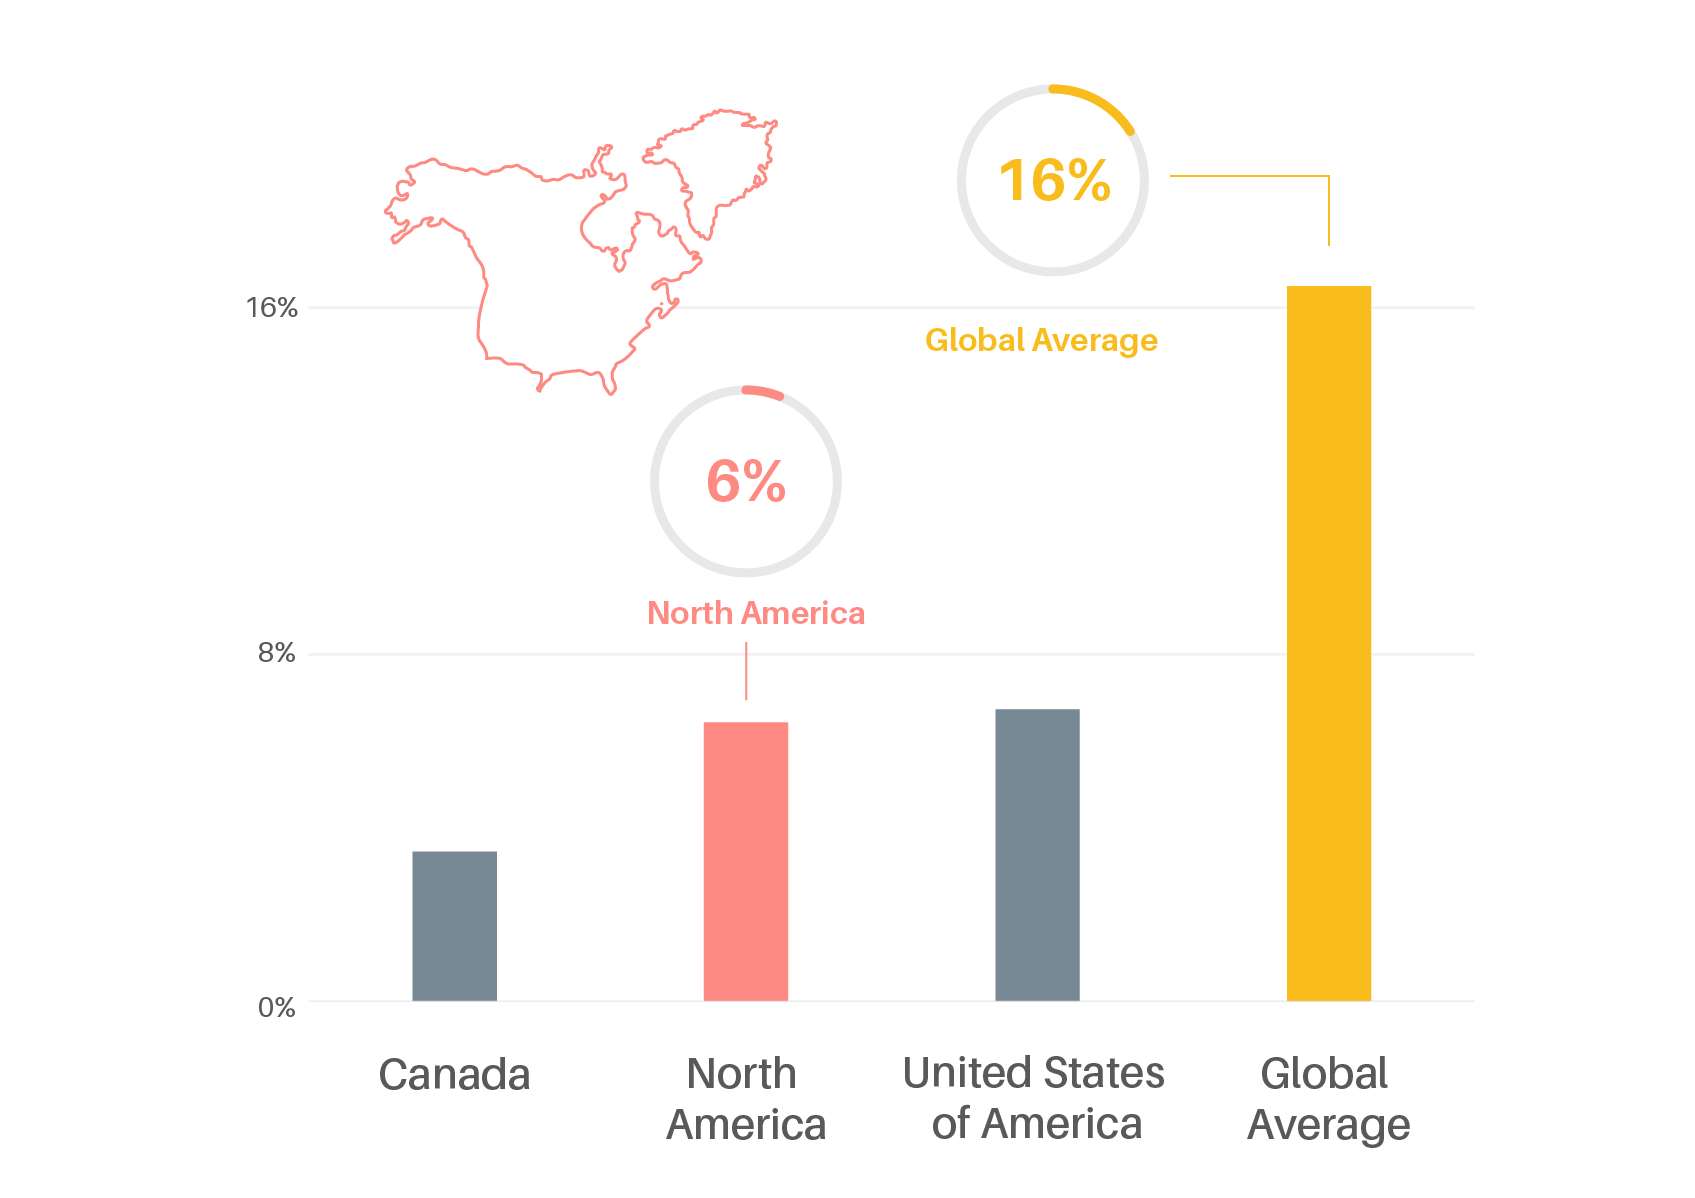
Figure 4.
Per capita transport CO2 emissions in North America, 2019
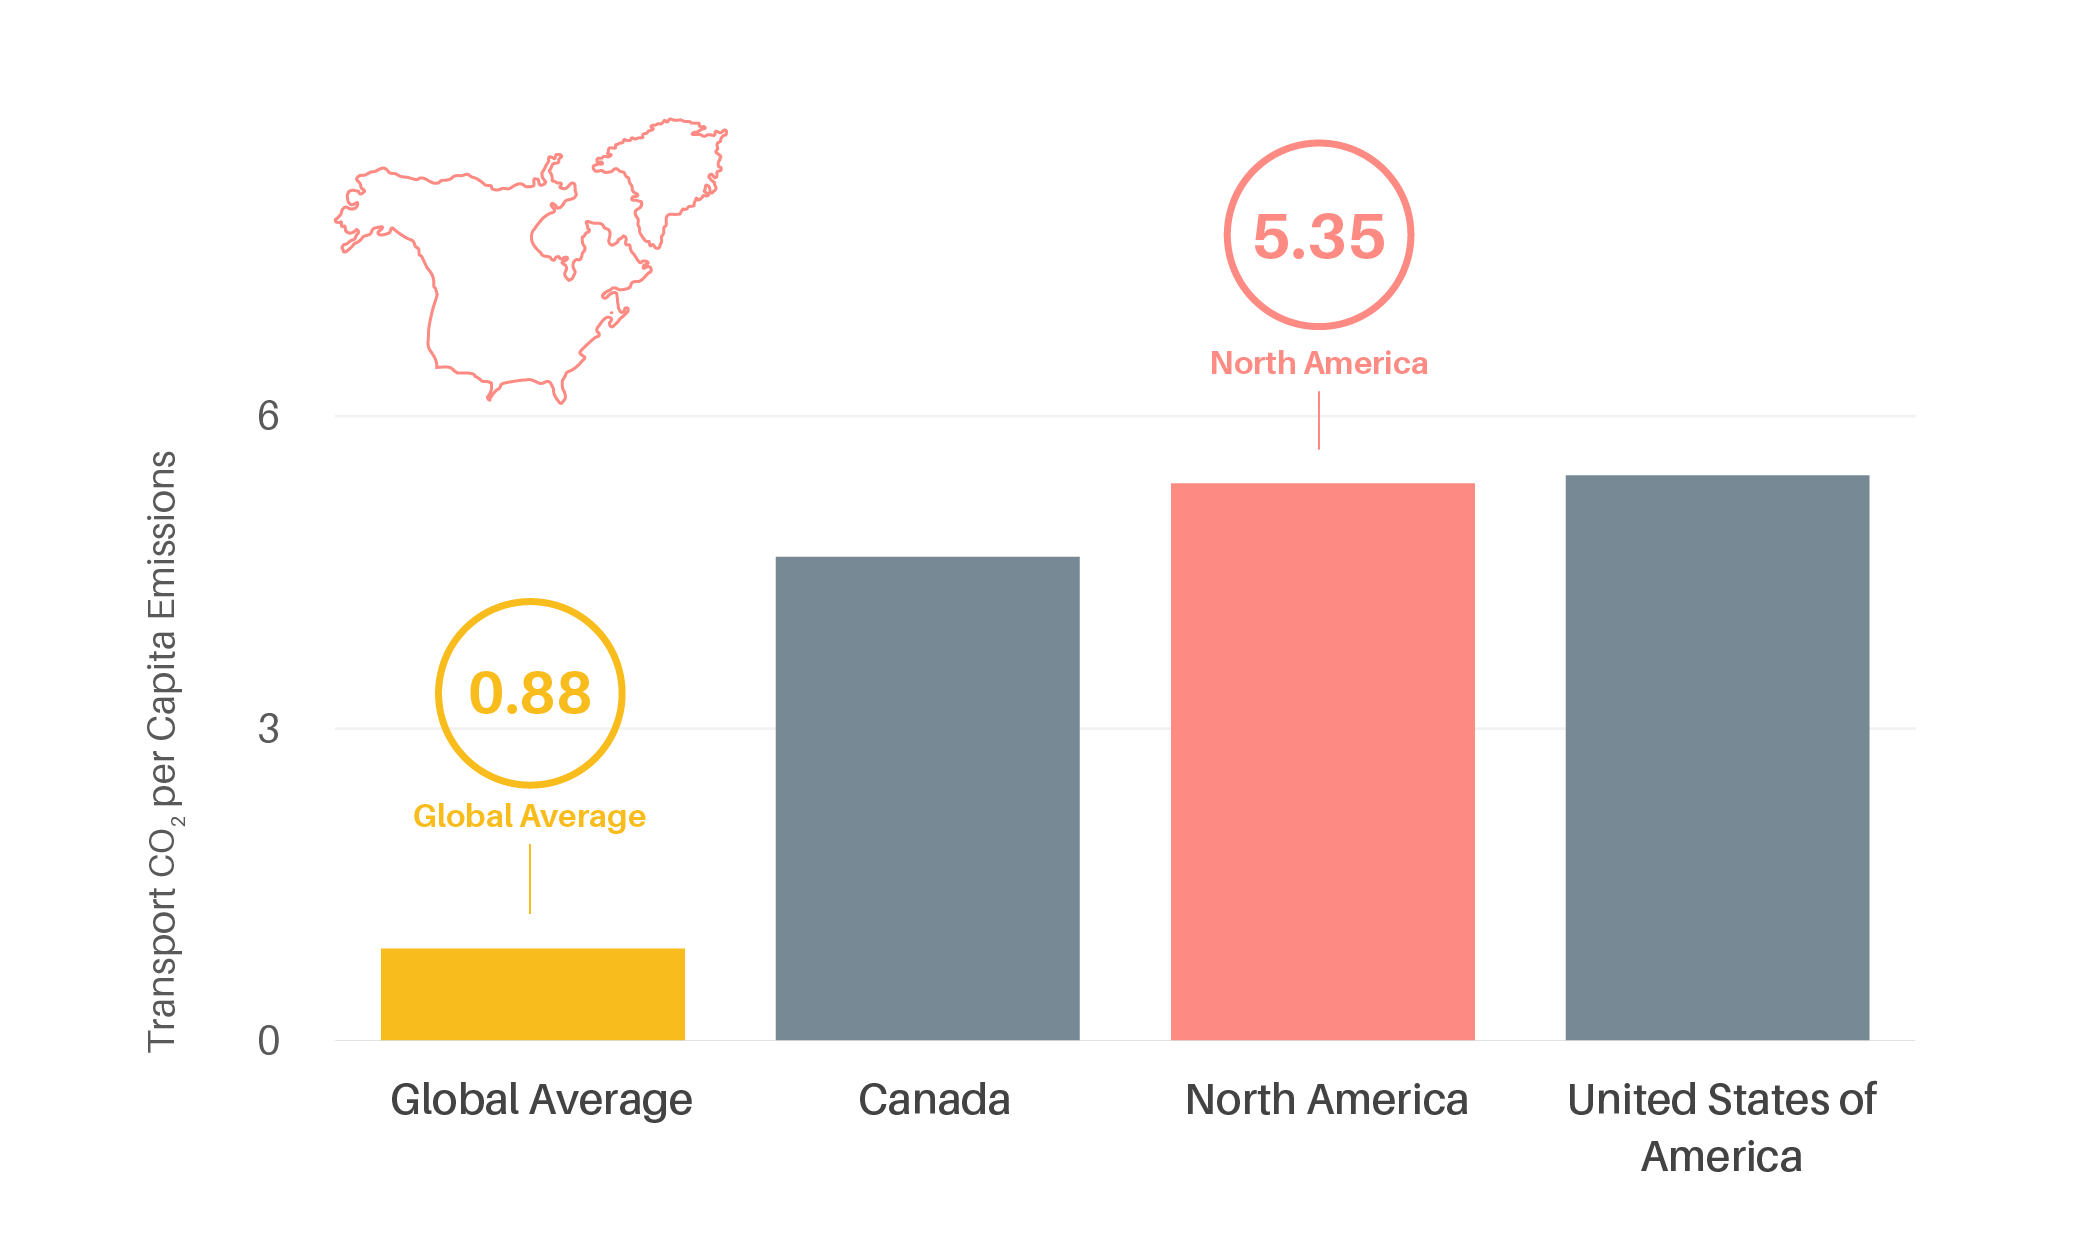
Transport CO2 emissions of the USA in 2014 were dominated by internal combustion engines, led by passenger cars (42%), freight trucks (23%) and light-duty trucks (18%).
Transport emissions in North America are being decoupled from economic activity (decreasing 12-14% per unit of GDP from 2010 to 2019), while absolute transport emissions continued to rise through 2019.
In the USA, domestic aviation accounted for nearly 7% of transport CO2 emissions in 2014; however, much of the country’s aviation emissions remain unaccounted for, as international flights represent the majority of air travel miles.
-
Policy Measures
At least 43 states of the USA and the District of Columbia took policy actions in 2019 related to electric vehicles and charging infrastructure.
In 2019, Canada adopted a target for 100% zero-emission passenger vehicles by 2040, and in 2020, 15 states of the USA and the District of Columbia collectively pledged to sell only electric medium- and heavy-duty vehicles by 2050.
Sustainable freight measures in North America focused on zero-emission vehicle targets and efforts to shift delivery patterns.
In 2019, nearly 140 million trips were taken on shared bicycles and scooters in the USA, up 60% from 2018. Shared scooter use grew more than 100%, while shared bike use increased around 10%.
Active commuting rates in much of the USA remained low in 2017, with walking declining and cycling remaining level, while walking was the fastest growing mode in Vancouver, Canada in 2018.
-
Impacts of the COVID-19 pandemic
In April 2020, after the onset of the pandemic, trans-border road and rail freight between the USA and neighbouring Canada and Mexico dropped nearly 45% from a year earlier, to its lowest level since 2009.
Cities across Canada and the USA re-allocated road space to pedestrians and cyclists to encourage physical distancing and active transport in response to the pandemic.
