Electric Mobility
Between 2019 and 2020, the global landscape of electric mobility shifted from “commitment-centric” to “implementation-minded.” Many public and private players have set specific targets for electrifying their fleets and banning diesel and petrol vehicles in countries or cities by a certain year. Interest has also risen in electric two- and three-wheelers. Logistics businesses have increased investments in electric fleets, and electric freight vehicles (such as trucks and electric cargo bikes) are being deployed in Europe, North America and Asia.
Large-scale progress in electric mobility has been concentrated in China and Europe. However, these experiences have pointed to the need to identify partnerships, policies and new business models for implementing projects (such as creating broad charging infrastructure networks) and operating them viably and equitably. Key to sustainable electric mobility is maximising the intermodality among sustainable, low carbon transport modes (both passenger and freight). Governments, industry, civil society and citizens need to create an enabling environment for sustainable mobility. In developing countries, electrifying all transport modes, starting with motorcycles, public transport, and rail, can avoid fossil fuel dependency and the high costs associated with air pollution and private car ownership.
The COVID-19 pandemic accelerated the uptake of electric vehicles through increased purchase subsidies, which were included in economic stimulus packages. Sales of electric passenger cars grew strongly in major markets in 2020, and in North America and Europe many commuters shifted to electric-assisted bicycles, leading to three-digit growth in e-bike sales.
Key Findings
-
Demand trends
The global stock of electric passenger cars (battery and plug-in electric hybrids) grew 40% in 2020 to more than 10 million vehicles (up from more than 7.2 million in 2019); this represented 1% of the 2020 total vehicle stock.
Figure 1.
Electric passenger car stock (battery and plug-in electric hybrids), by region, 2010-2020
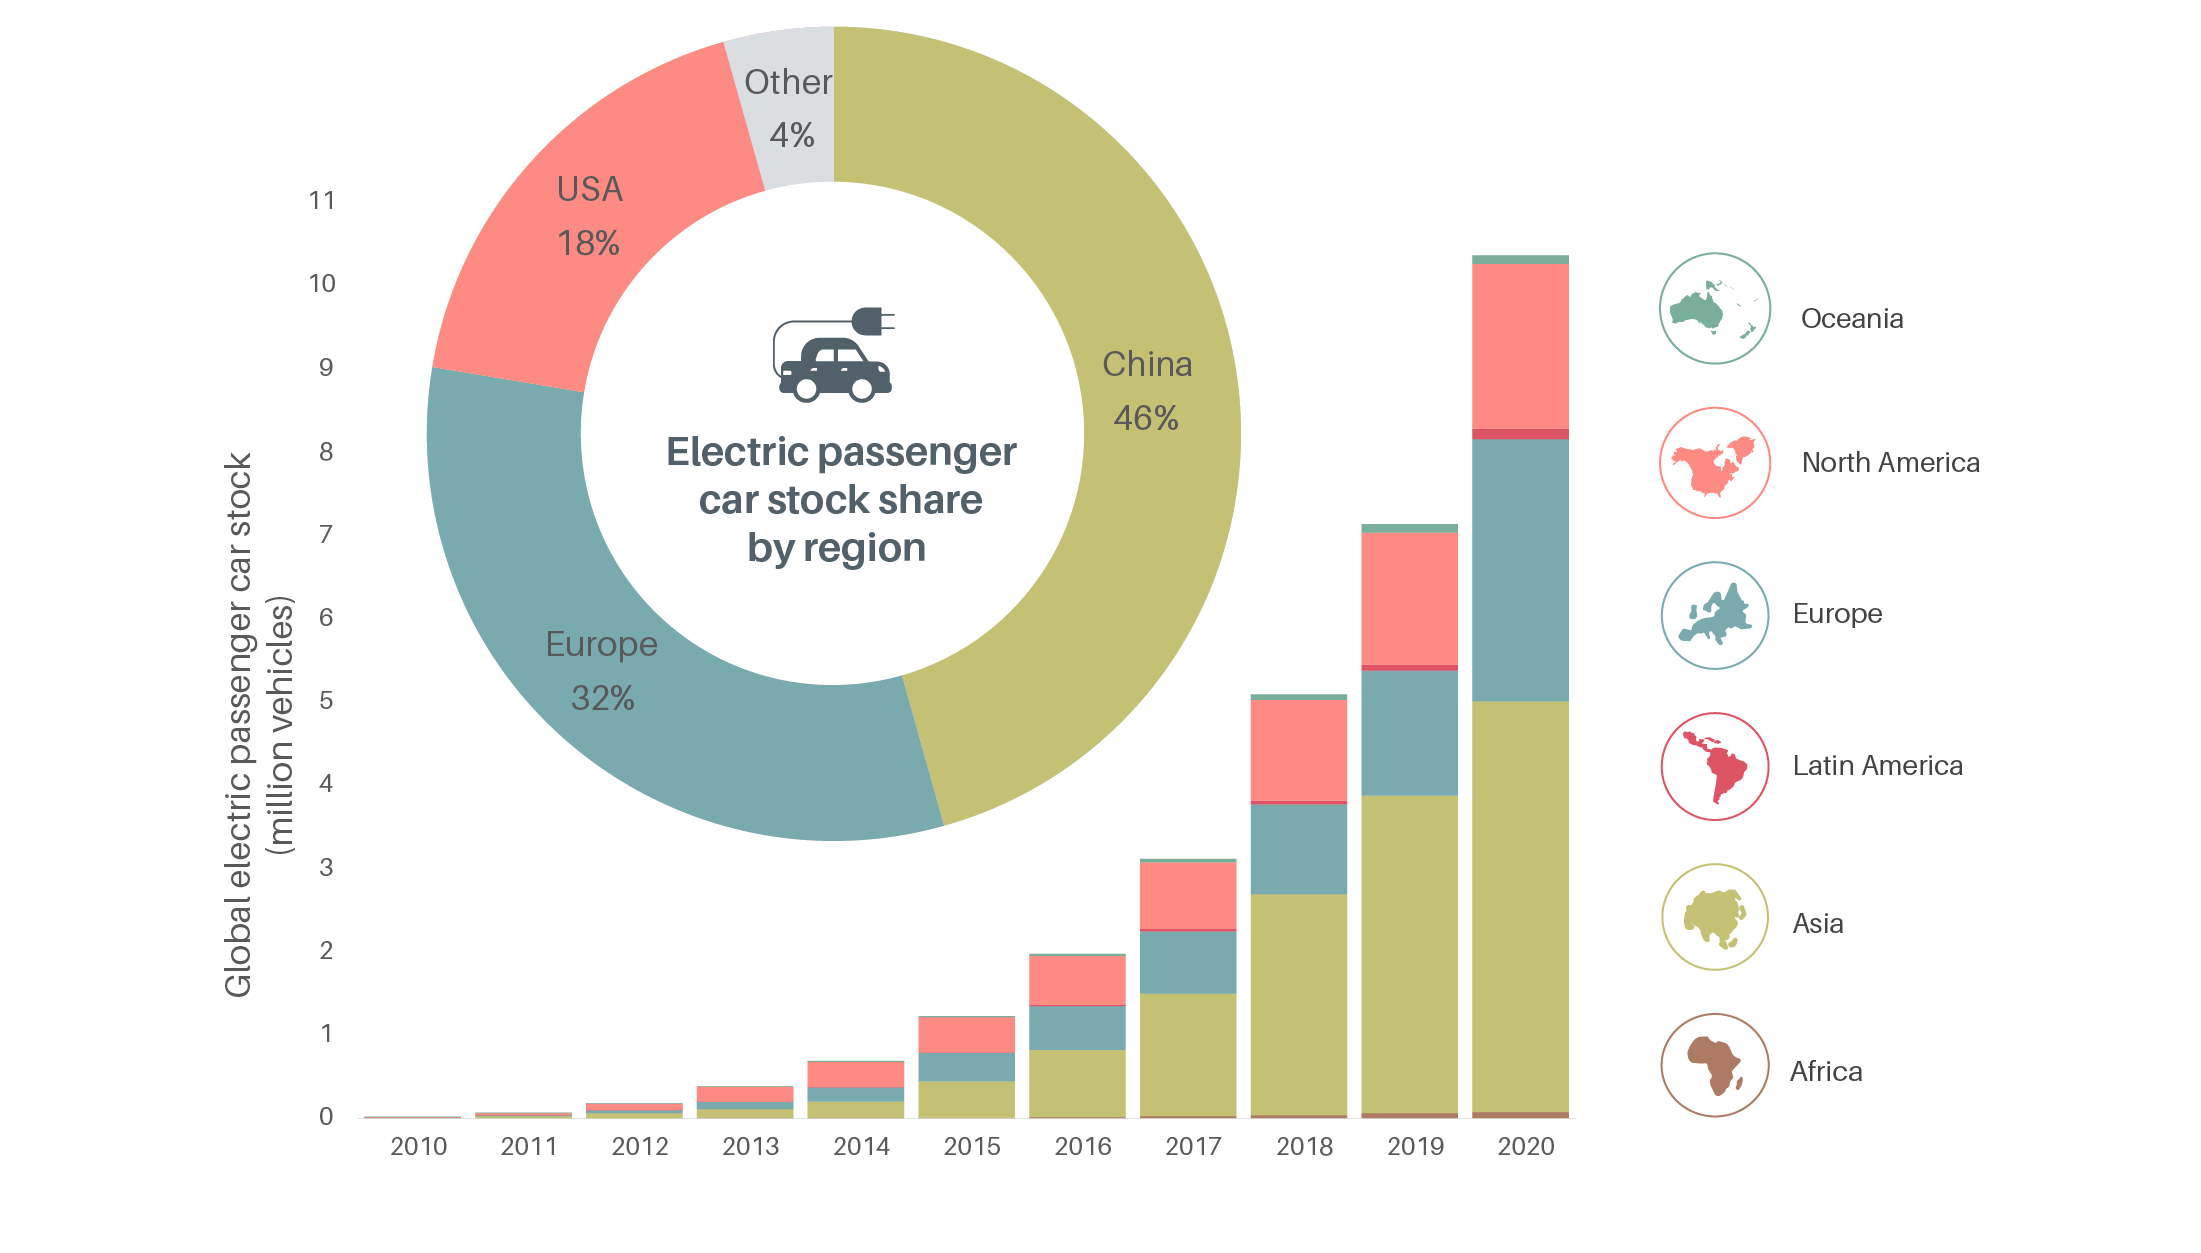
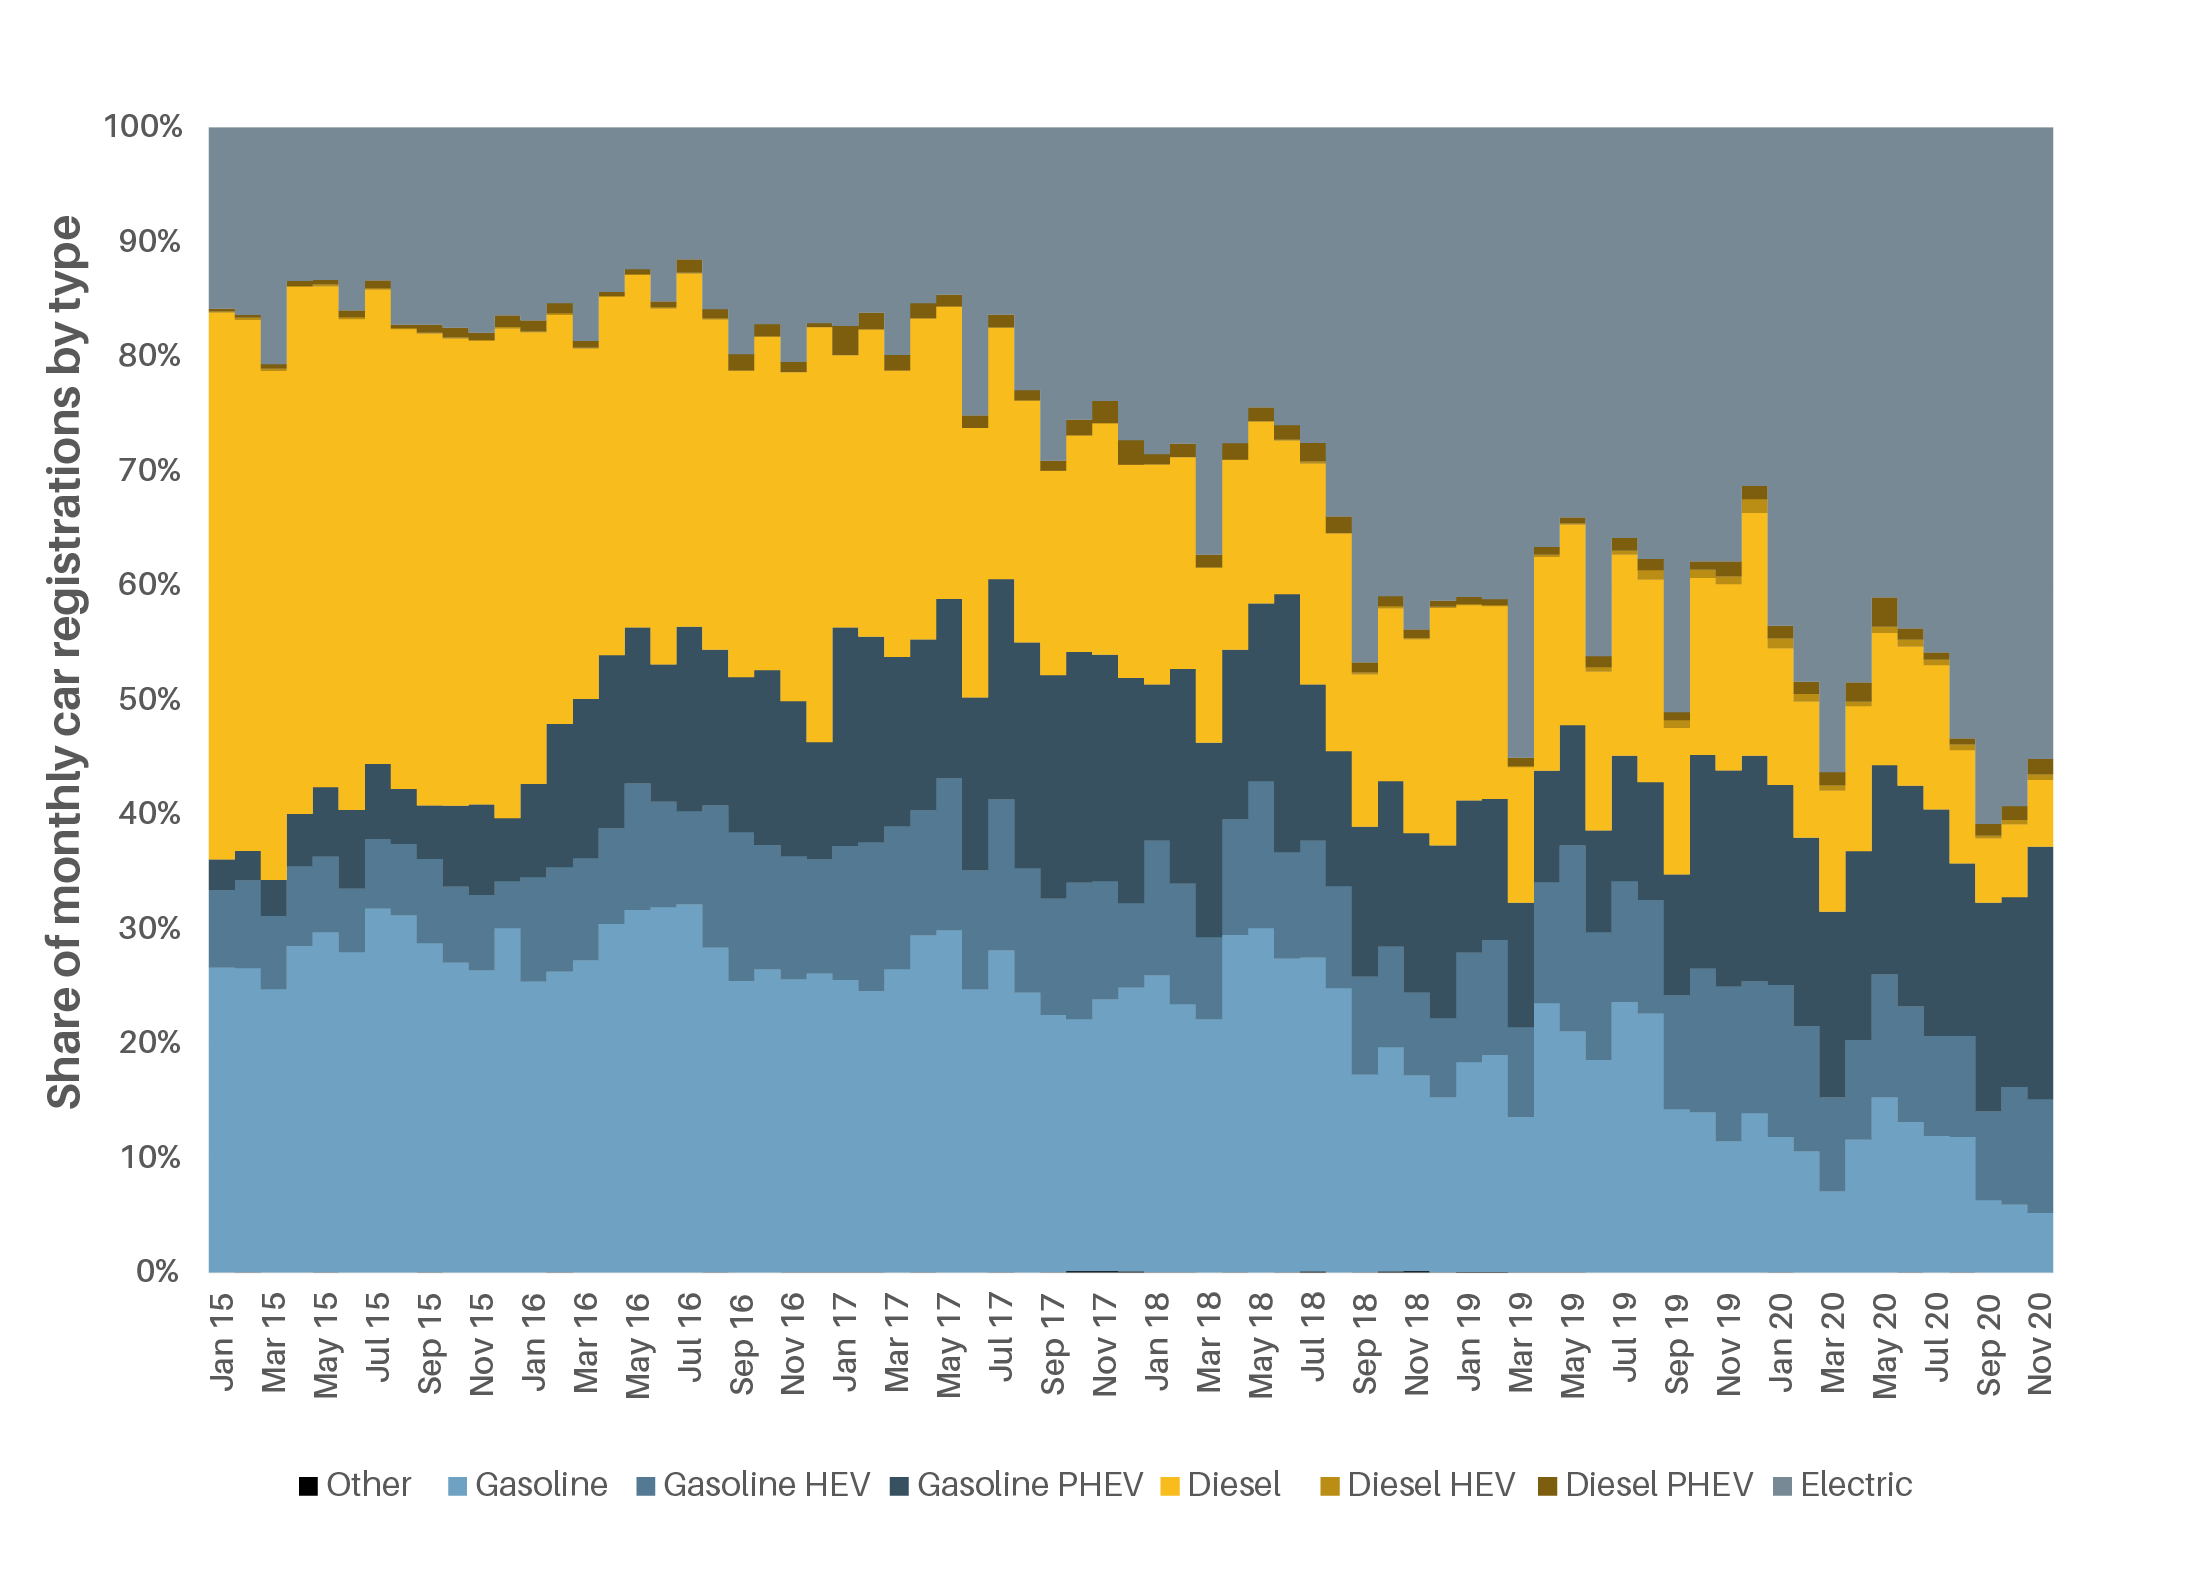
Figure 2.
New car registrations in Norway by vehicle type, 2015-2020
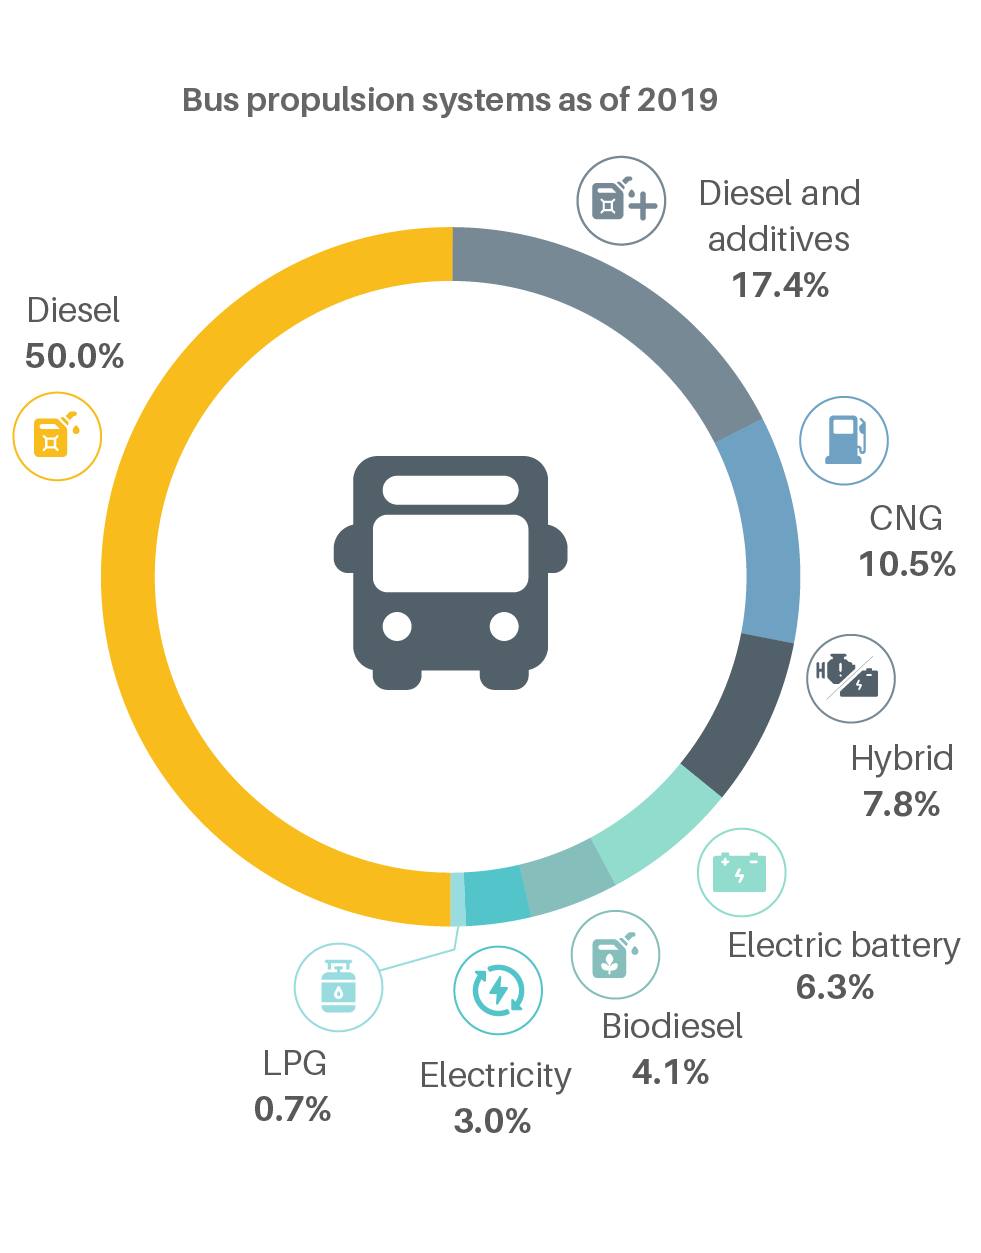
More than 600,000 electric buses were in operation in 2020. As of 2019, 18% of the world’s buses were powered through electric sources, including battery electric (6.3%), hybrid-electric (7.9%) and direct overhead wires and similar (3%).
Figure 3.
Shares of bus propulsion systems globally, by type, 2019
The global stock of electric two- and three-wheelers (excluding electric-assisted bikes) totalled 290 million in 2020. Around one-quarter of all motorised two-wheelers worldwide were electric that year.
Electric-assisted bicycles (e-bikes) are by far the most popular electrified road transport mode in Europe and North America; e-bike sales in Europe surpassed 4.8 million units in 2020, three times the number of electric passenger cars sold in the European Union (EU) that year.
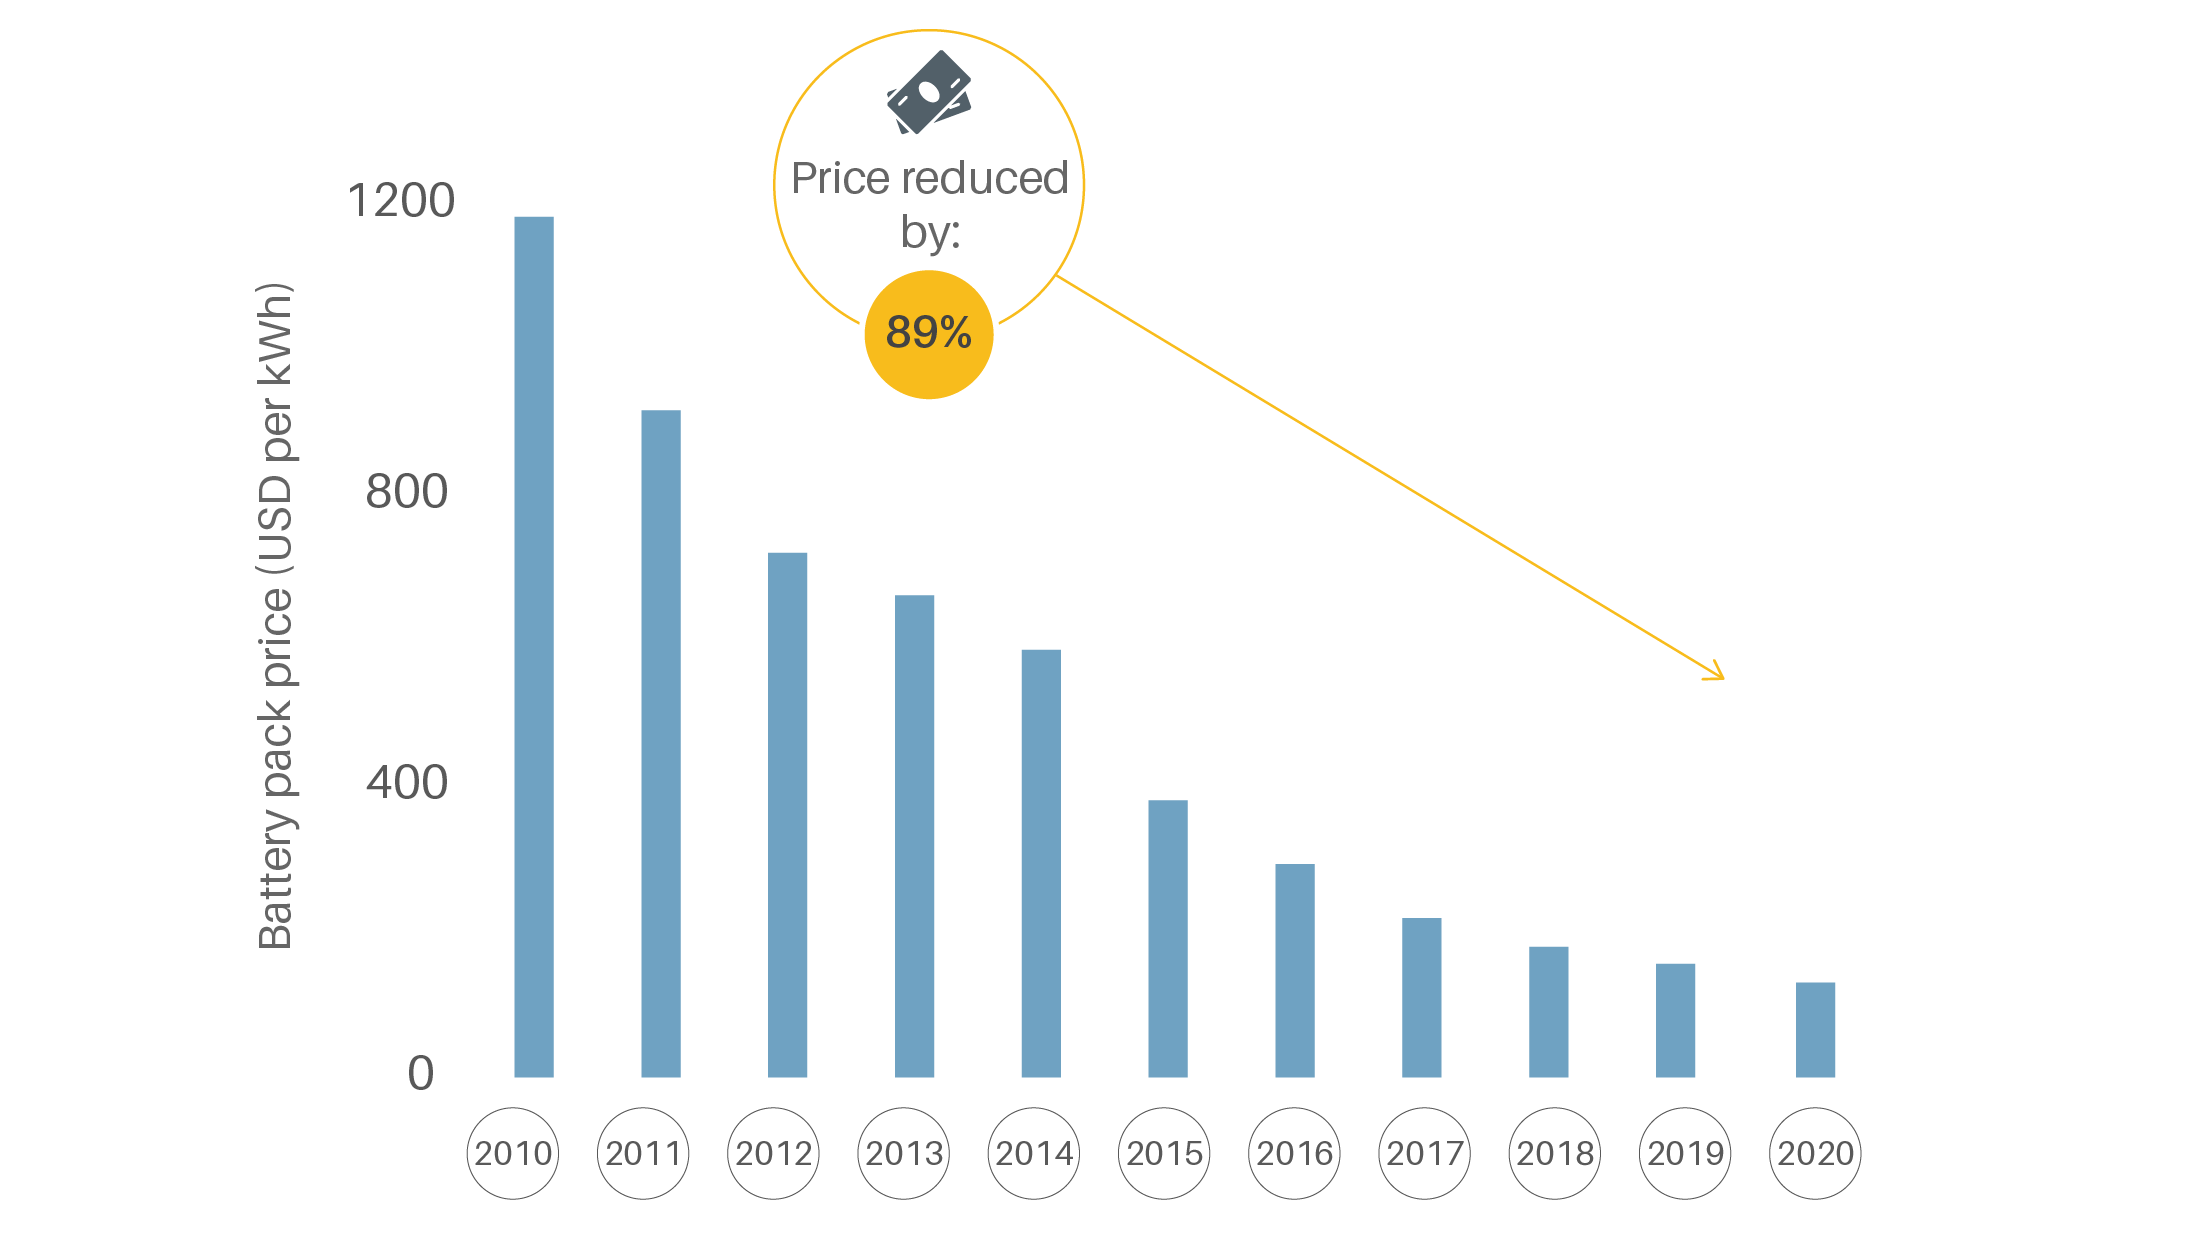
Between 2010 and 2020, the average price of electric vehicle batteries dropped 88%, from around USD 1,200 per kilowatt-hour (kWh) to USD 137 per kWh, increasing the potential for more widespread uptake of electric vehicles.
Figure 4.
Average price of an electric vehicle battery pack, 2010-2020
By the end of 2020, more than 170,000 electric vehicles (three-wheelers, light trucks and company cars) were deployed through company fleets. Around 31,000 electric trucks were operating worldwide by year’s end, but they represented less than 1% of total truck sales.
Public and private charging infrastructure for electric vehicles has scaled up rapidly in some countries, although charging point distribution and the ratio of electric vehicles to charging points vary widely.
-
Emission trends
Electric vehicles contribute at least 22% fewer carbon dioxide (CO2) emissions than internal combustion engines, even when the electricity used for charging is generated from fossil fuel sources. While electric vehicles are more energy efficient than conventional vehicles overall, they offer even greater potential for emission reductions if they are based on clean renewable energy.
Life-cycle emissions and the impact of electric vehicle batteries must be considered when comparing the environmental footprints of electric versus conventional vehicles. Major concerns include the extraction of raw materials and the recycling of batteries. Policies to extend the useful life of electric vehicle batteries can help governments and manufacturers offset the production costs, impacts and emissions.
-
Policy Measures
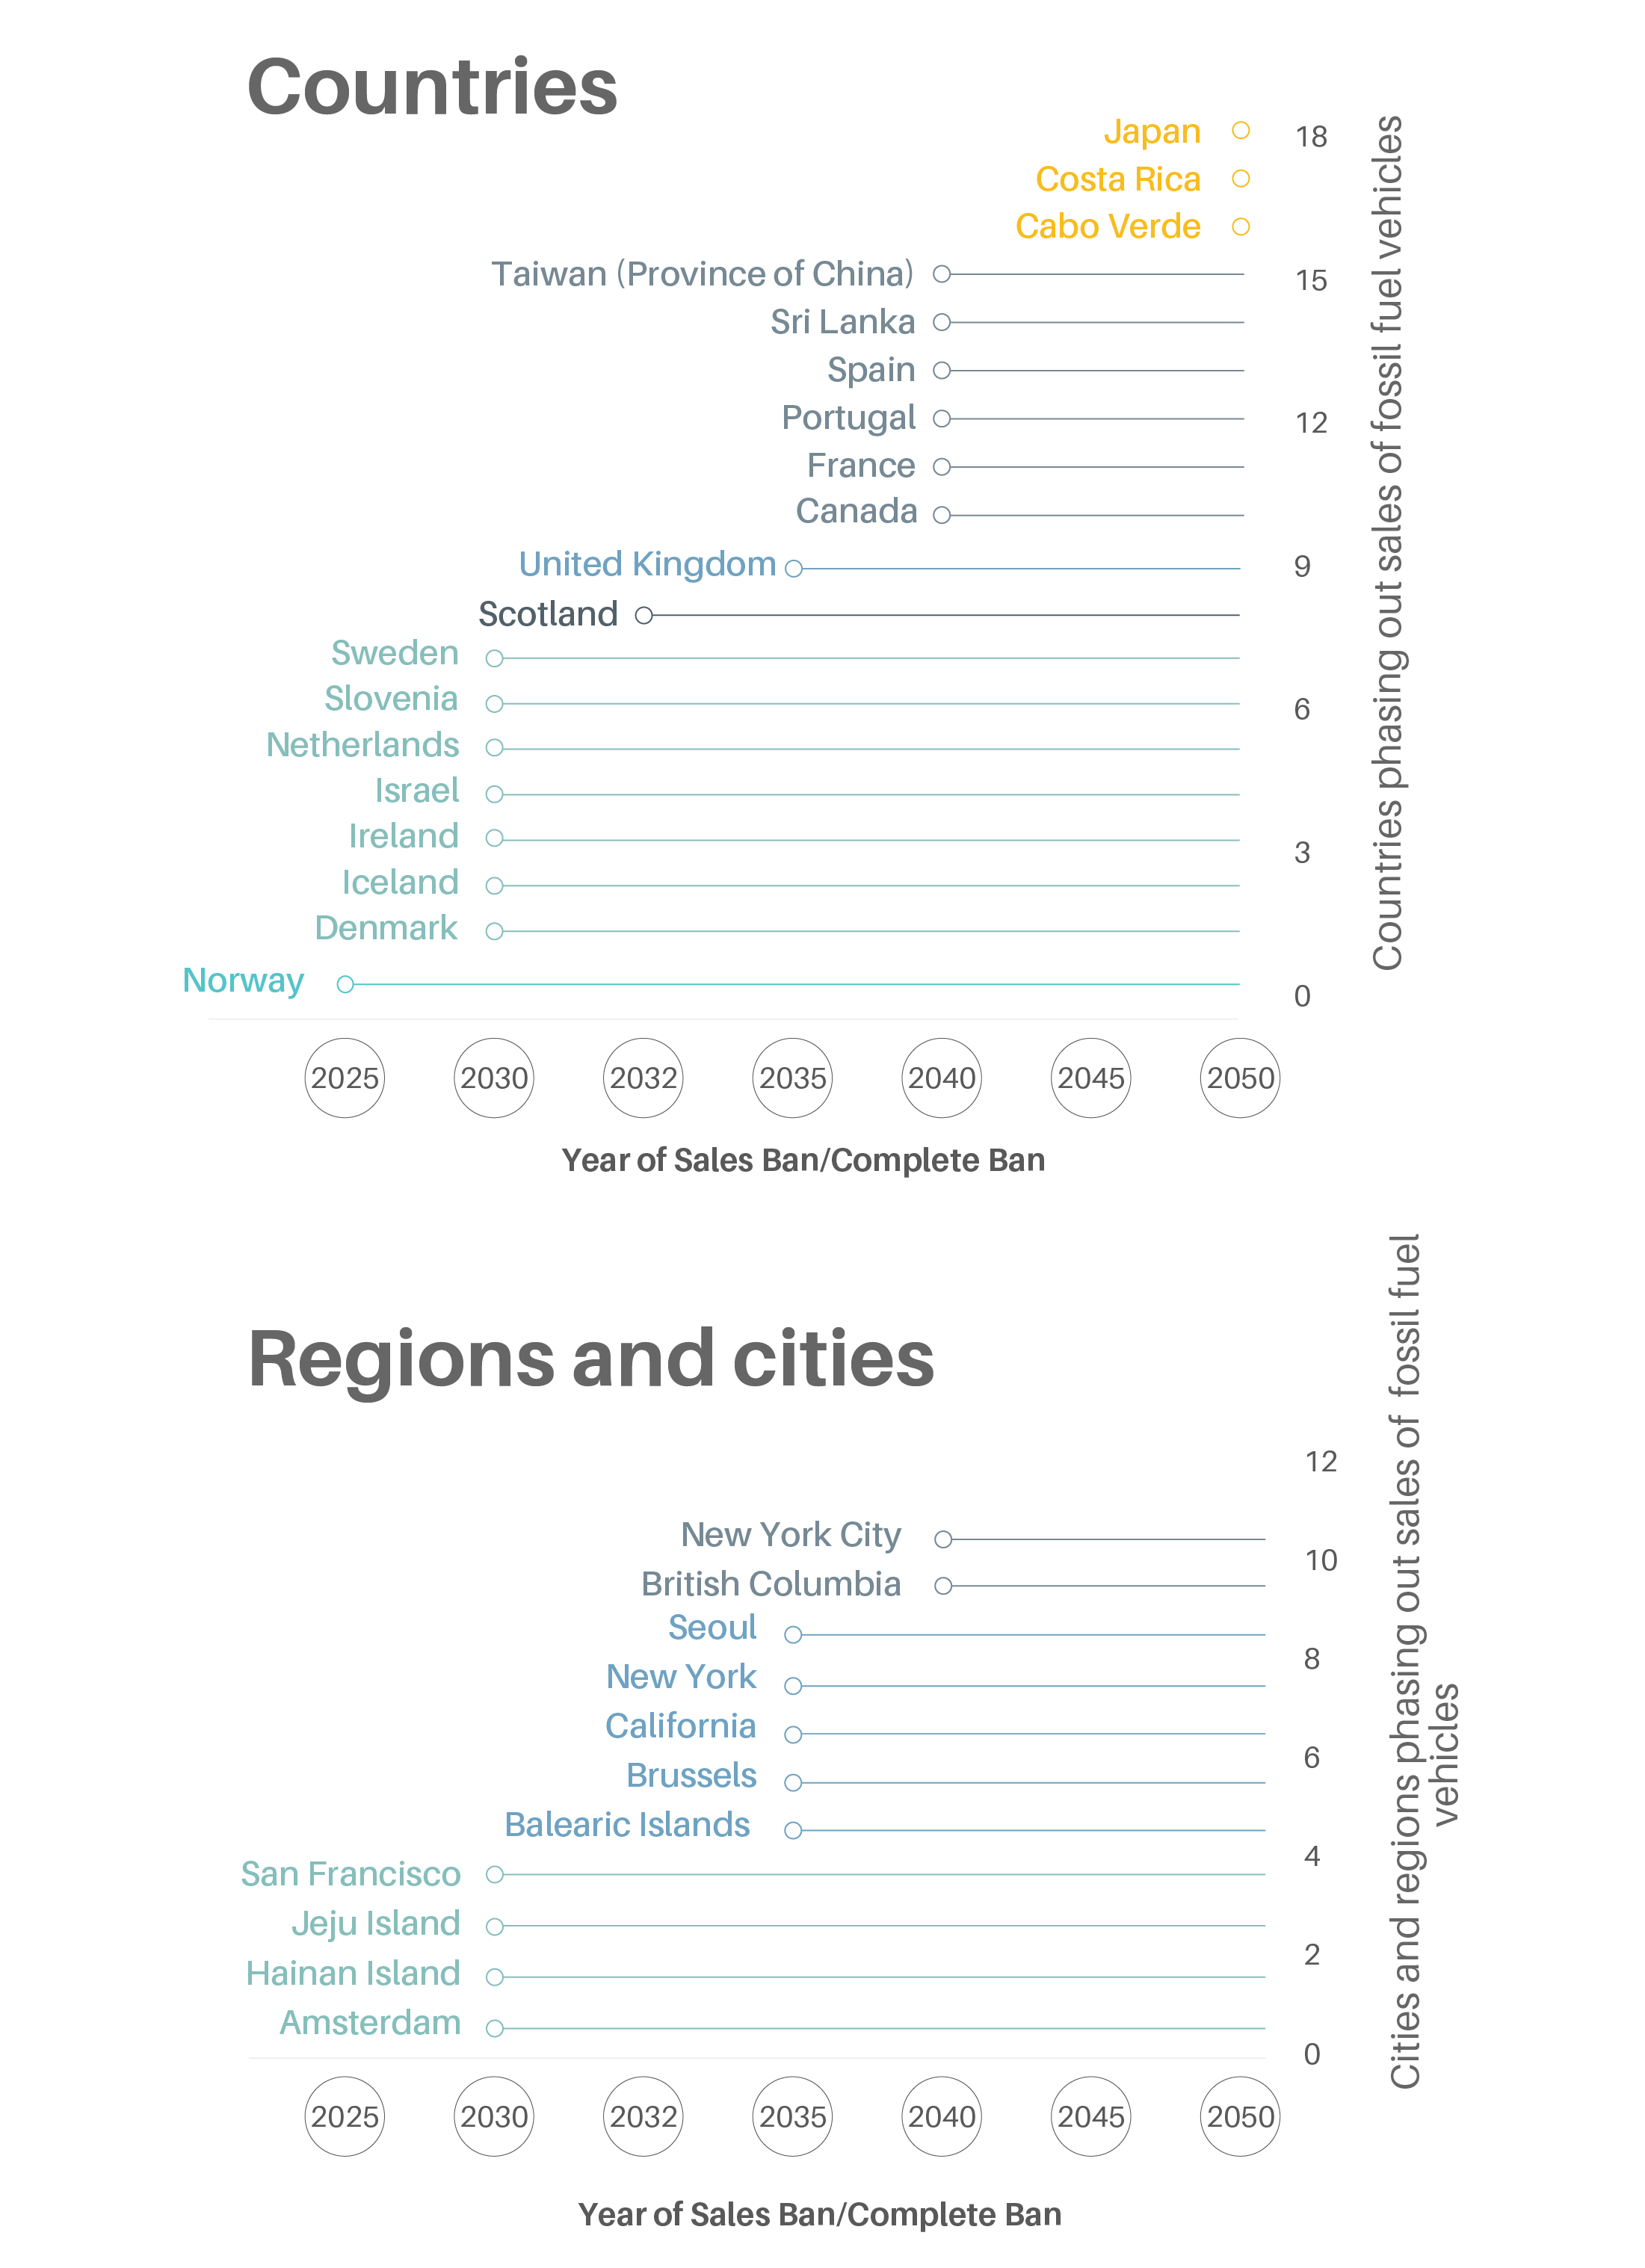
Countries have adopted ambitious time-bound targets to increase the share of electric vehicles in their overall fleets. By the end of 2020, 19 countries or sub-national jurisdictions had set targets to phase out diesel and petrol passenger vehicles.
Figure 5.
Countries, regions and cities with commitments to phase out fossil fuel vehicles, by target year
In 2020, the first-of-its-kind Zero Emission Vehicle Transition Council was established, comprising ministers and representatives from the world’s largest and most progressive car markets.
In response to phase-out targets by countries, major automobile companies are halting the development of internal combustion engines and accelerating their electric vehicle ambitions towards the 2030/2035 time frame.
Leapfrogging to electric mobility in Africa, Asia and Latin America can bring significant benefits to local environments and economies.
Utilities are taking on a greater role in the mobility ecosystem, thereby merging the value chains for electricity generation and electric vehicle charging.
-
Impacts of the COVID-19 pandemic
In the wake of the pandemic, there has been pressure on regulators to ease future vehicle fuel economy and emission standards, which are critical to addressing the climate crisis and the health impacts of air pollution.
Following the pandemic, many national and local trends point towards a short-term exodus from public transport and a shift to greater passenger car use, highlighting the need to maintain robust fuel economy standards.
Key indicators
2018*
2020*
% change
Key indicators
2018*
2020*
% change
Key indicators
2018*
2020*
% change
Key indicators
2018*
2020*
% change
Key indicators
2018*
2020*
% change
Key indicators
2018*
2020*
% change
Key indicators
2018*
2020*
% change
Key indicators
2018*
2020*
% change
Key indicators
2018*
2020*
% change
Key indicators
2018*
2020*
% change
(*) Data are for the indicated year unless noted otherwise.

