Transport Demand
Population growth and density, as well as economic growth and development, play an important role in driving transport activity. Urbanisation has had far-reaching effects on transport demand as well as on energy efficiency, economic development, social equity and paratransit (sometimes called “informal transport”). Additional factors influencing transport demand (and related emissions) include energy prices, policies related to transport and land use, as well as people’s shifting behaviours and needs. Although comprehensive data for 2019 and 2020 are still emerging, various examples and indicators paint a picture of overall trends in the demand for both passenger and freight transport.
Key Findings
-
Drivers of transport demand
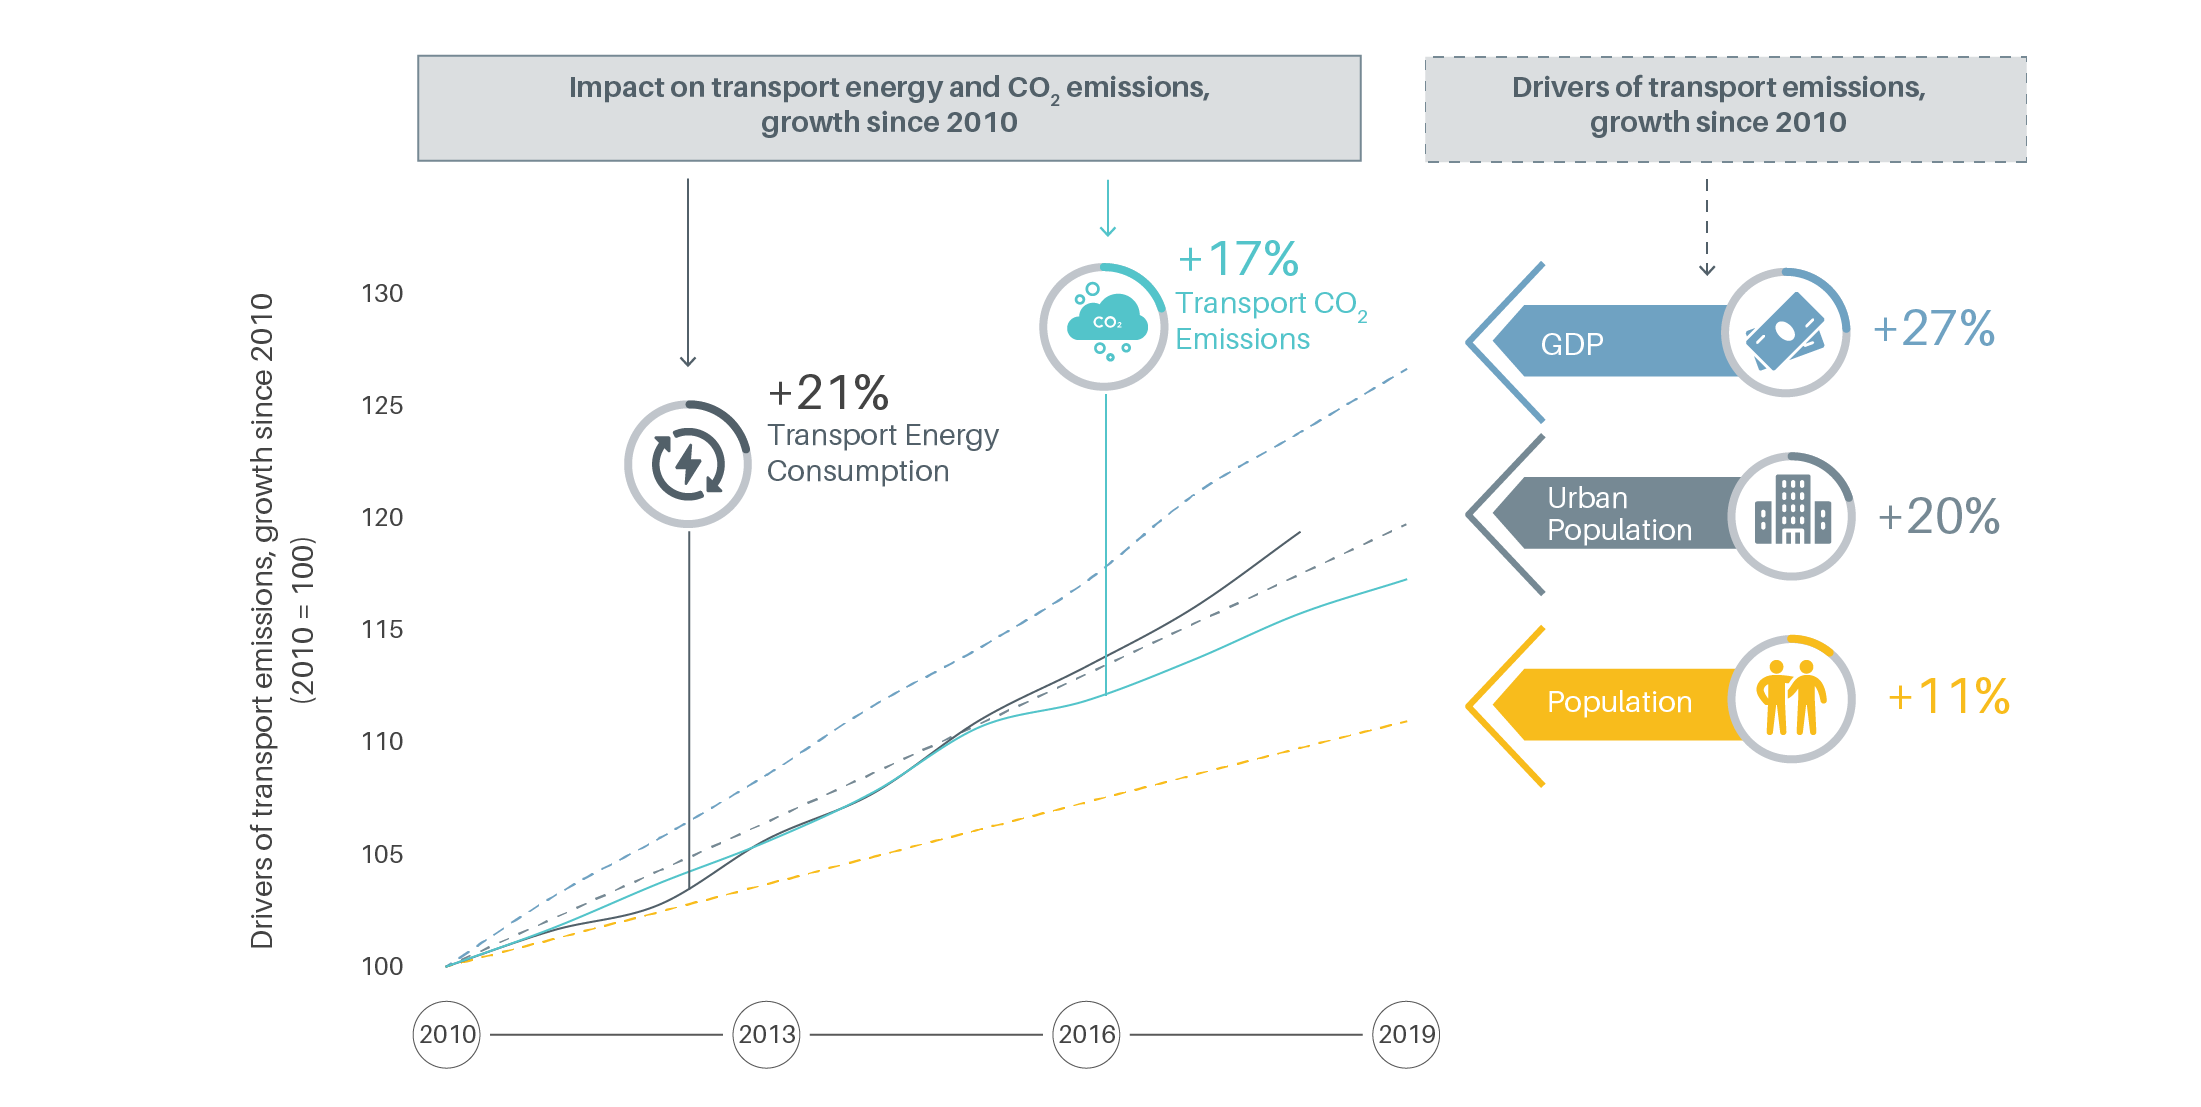
Global population increased 12% between 2010 and 2020, to an estimated 7.7 billion people, and the urban population grew nearly 20% over this period. As the population expands, more people worldwide need dependable transport services to access socio-economic activities and opportunities.
Growth in global gross domestic product (GDP) has exceeded growth in transport energy use since 2010. Global GDP grew 27% between 2010 and 2019 (average annual rate of 3%) and 2.2% in 2019, but it fell an estimated 4.3% in 2020 due to the impacts of COVID-19.
Figure 1.
Drivers and impacts of transport demand, 2010-2019
Global oil demand began declining in 2016, and this slide became a freefall in 2020 as the pandemic affected not only oil demand but also prices. The average price of West Texas Intermediate crude oil fell below USD 20 a barrel in 2020 (from USD 57 a barrel in 2019), as the reduction in travel led to a sharp drop in oil demand for transport.
Figure 2.
Total cost of ownership for cars, buses and trucks
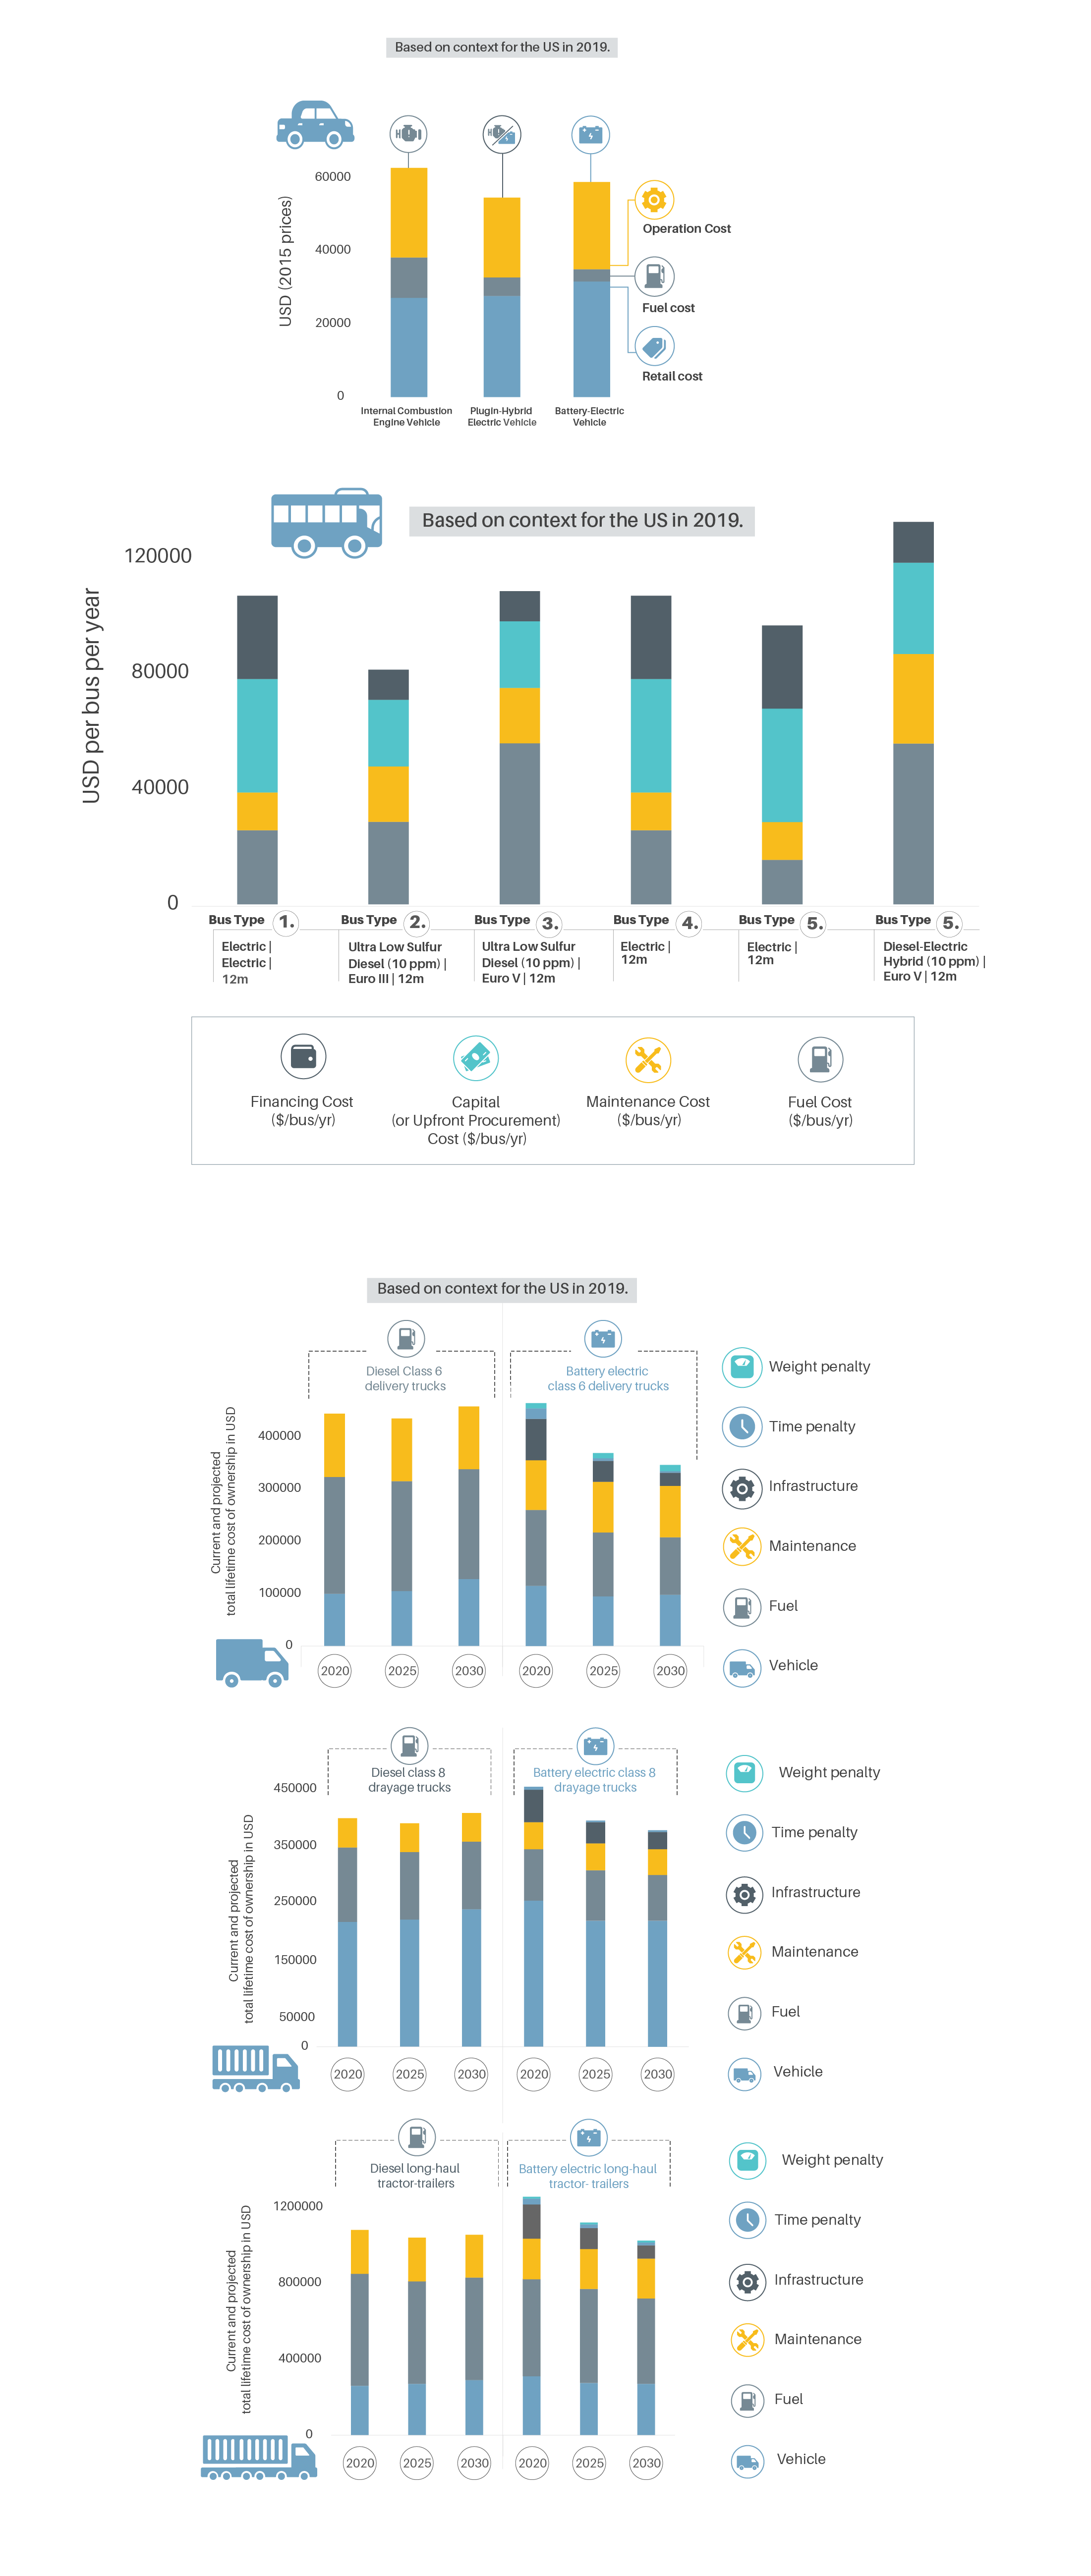
Even with the drop in oil prices, the payback period and total cost of ownership for electric cars and buses has become more competitive every year, and electric buses have increasingly displaced diesel fuel use.
Battery prices – a major factor behind the cost of electric vehicles – dropped 89% between 2010 and 2020, from USD 1,183 per kilowatt-hour (kWh) to an estimated USD 135 per kWh.
-
 Passenger transport supply and demand
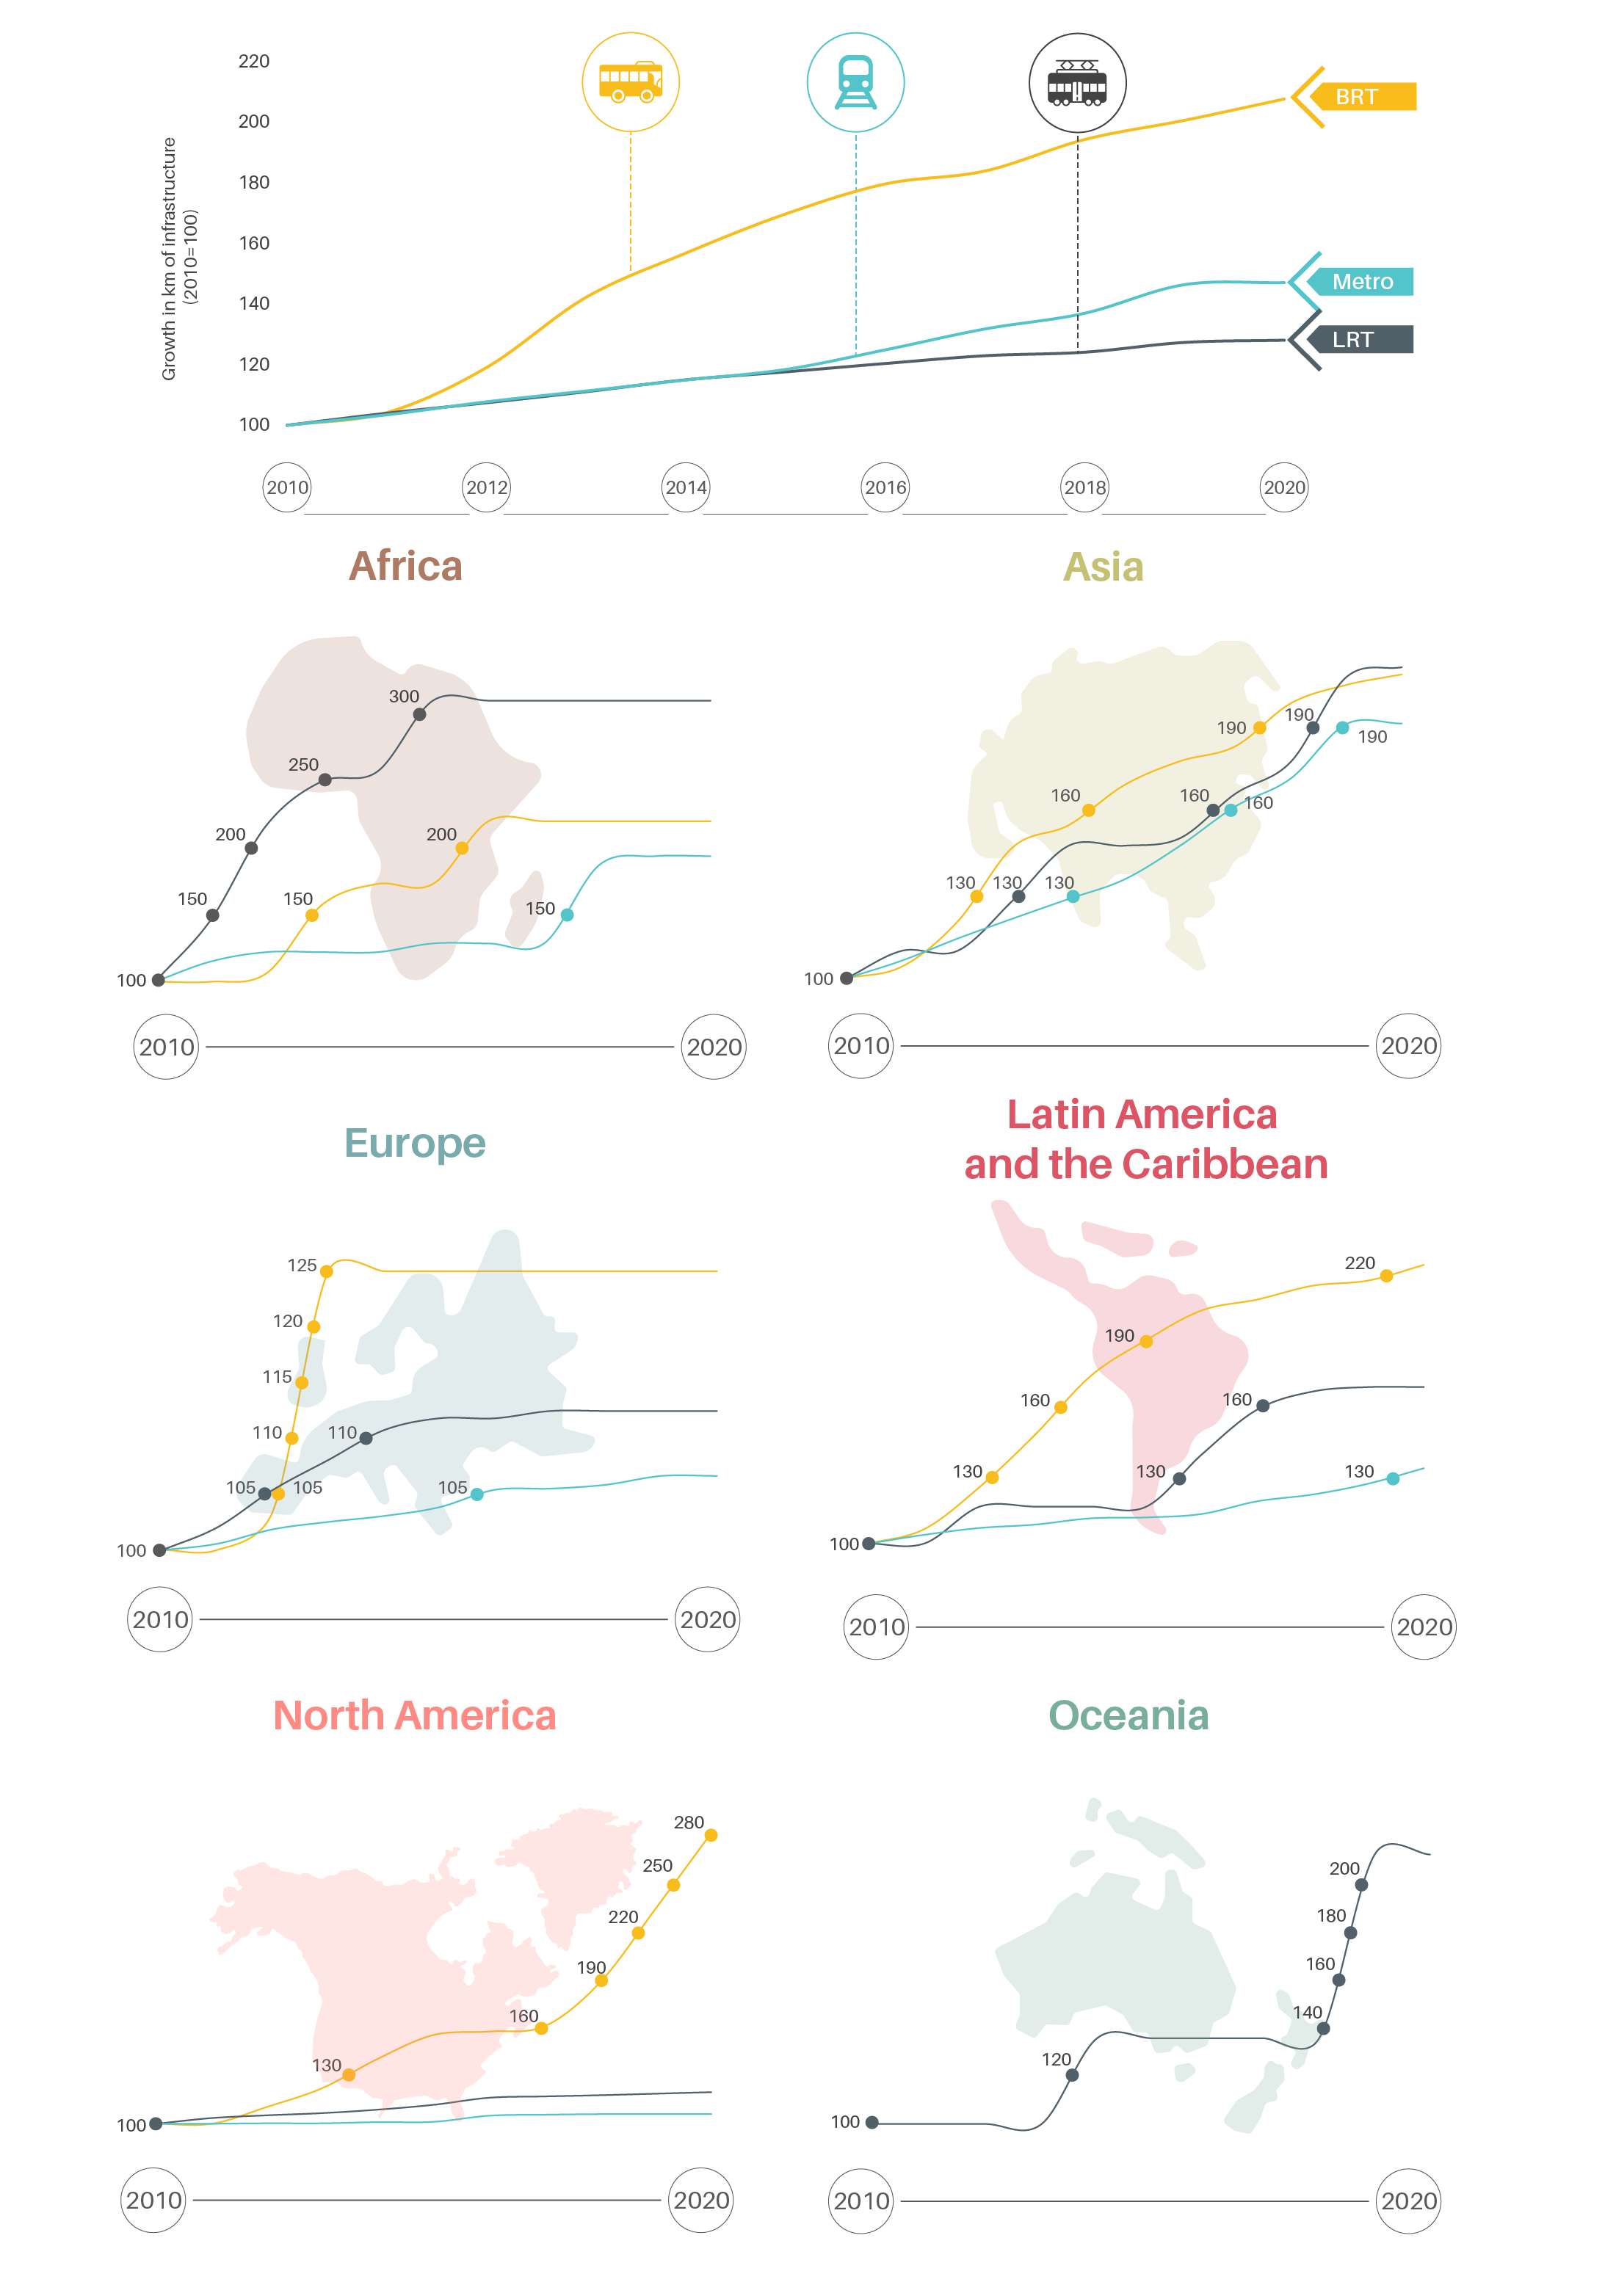
Global demand for public transport grew 4% per year between 2012 and 2017. Bus rapid transit, metro rail and light rail transit have expanded to varying degrees in nearly all regions, with bus rapid transit systems taking off in Europe and light rail becoming more prevalent in Oceania.
Figure 3.
Growth in bus rapid transit, metro systems and light rail transit, worldwide and by region, 2010-2020
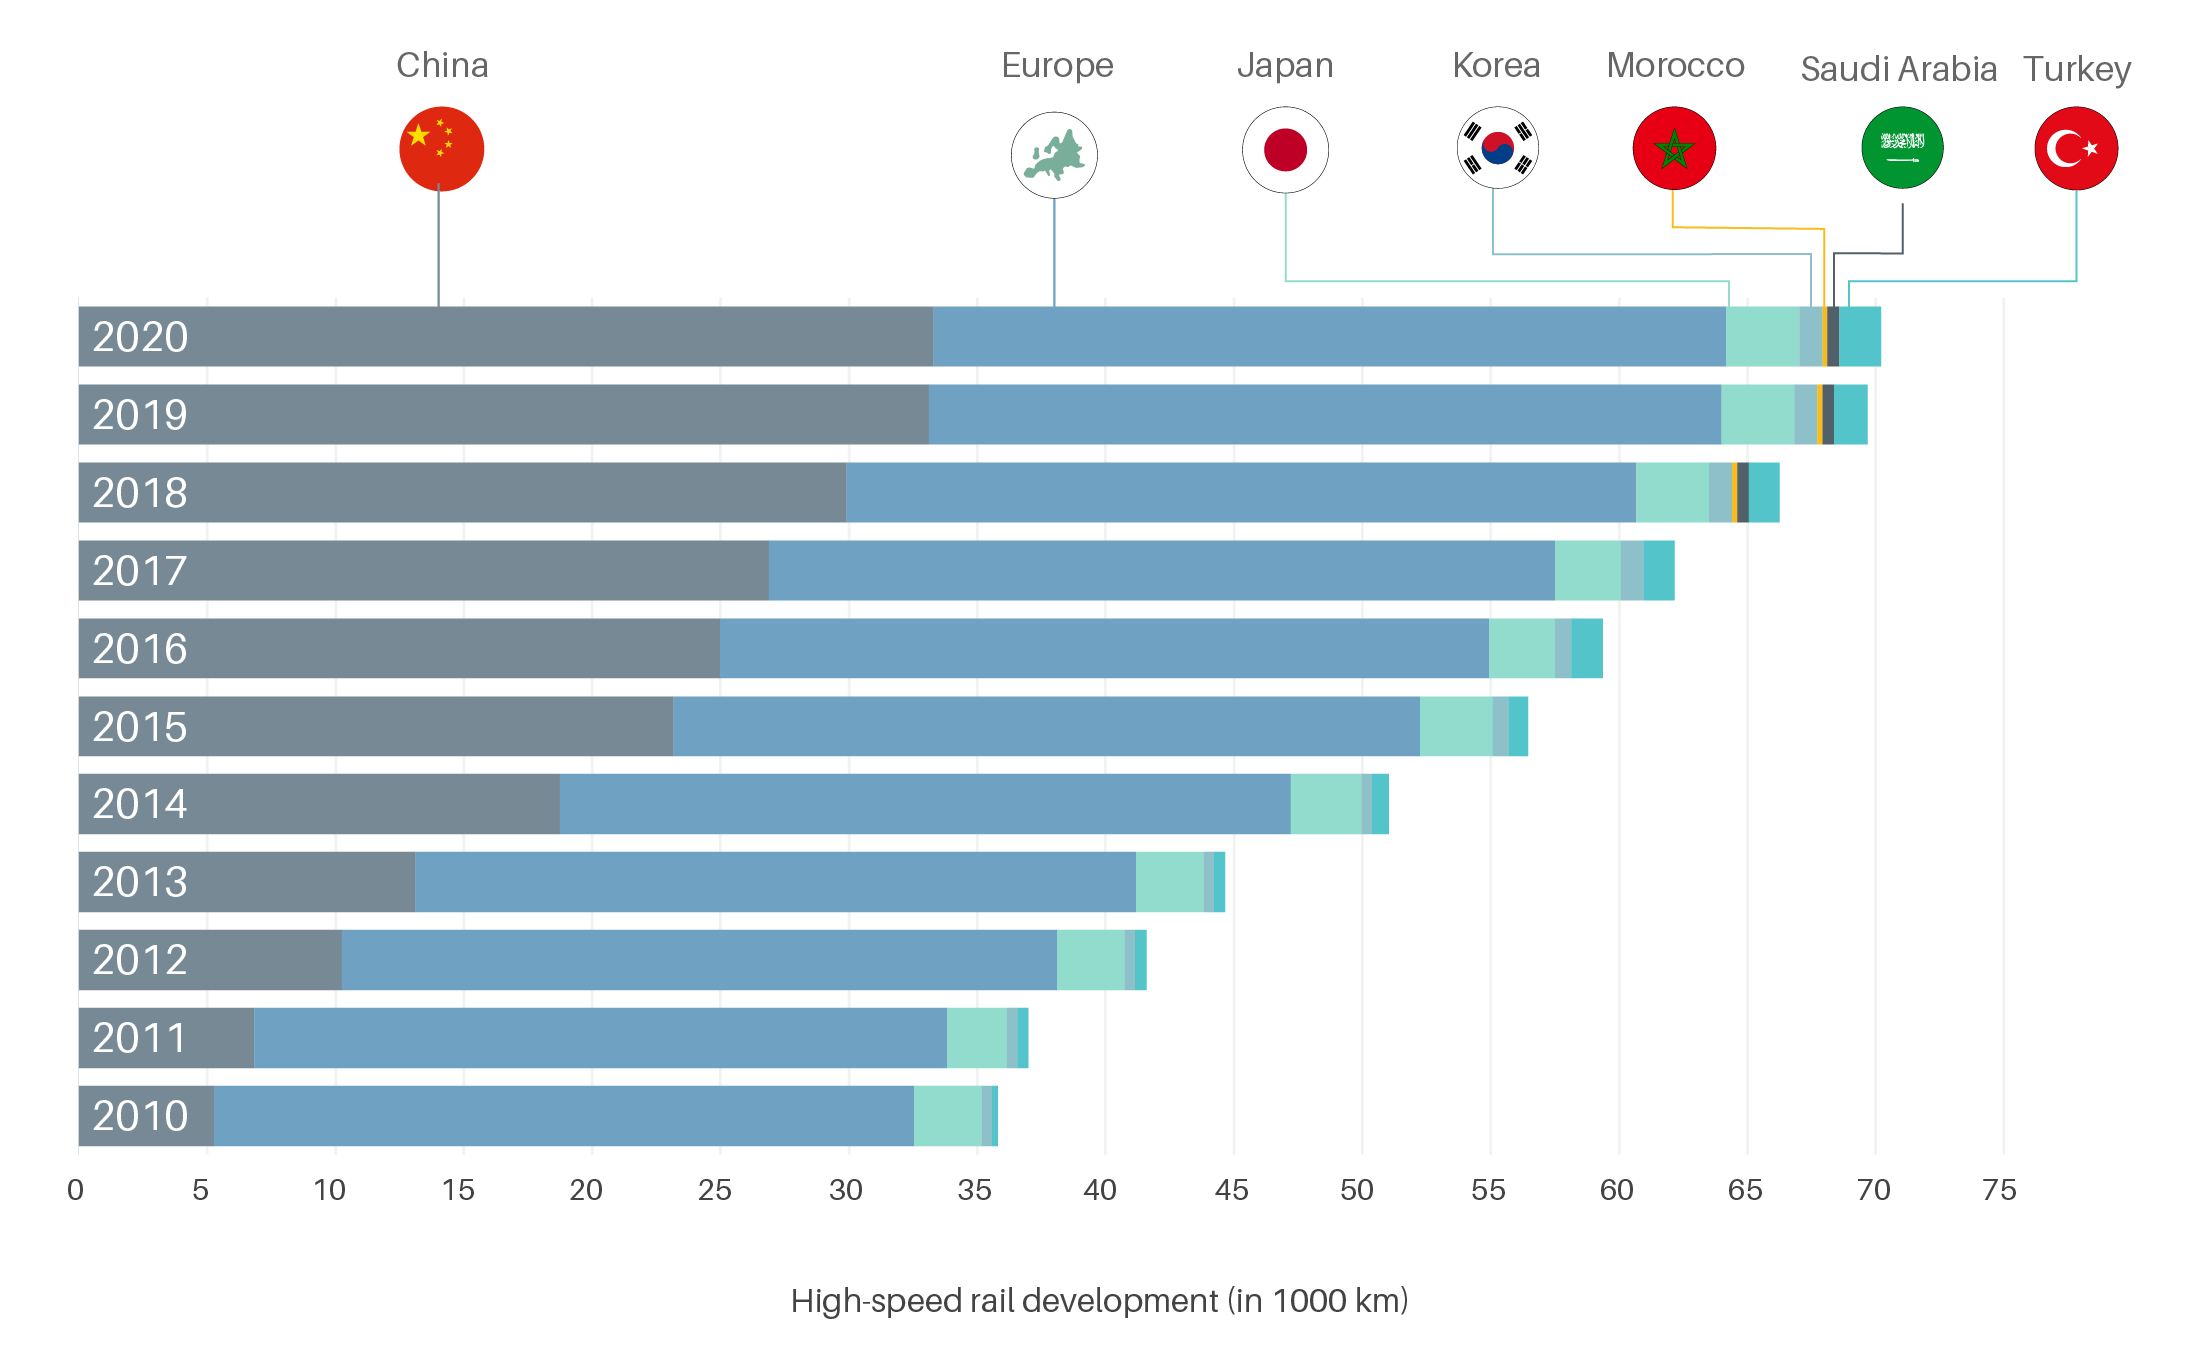
The movement for better inter-city rail options is spreading not only in Europe, where more routes have been planned and upgraded, but also in Canada, China and Thailand. Heavy rail carries 8% of all passengers travelling between cities. Passenger rail transport activity is 75% electrified, and China and India are home to most of the existing track as well as future projected
Figure 4.
High-speed rail development by region, 2010-2020
Global air travel increased 4.2% from 2018 to 2019. In late July 2019, around 225,000 airplanes were active on a single day, the largest daily movement of aircraft ever recorded.
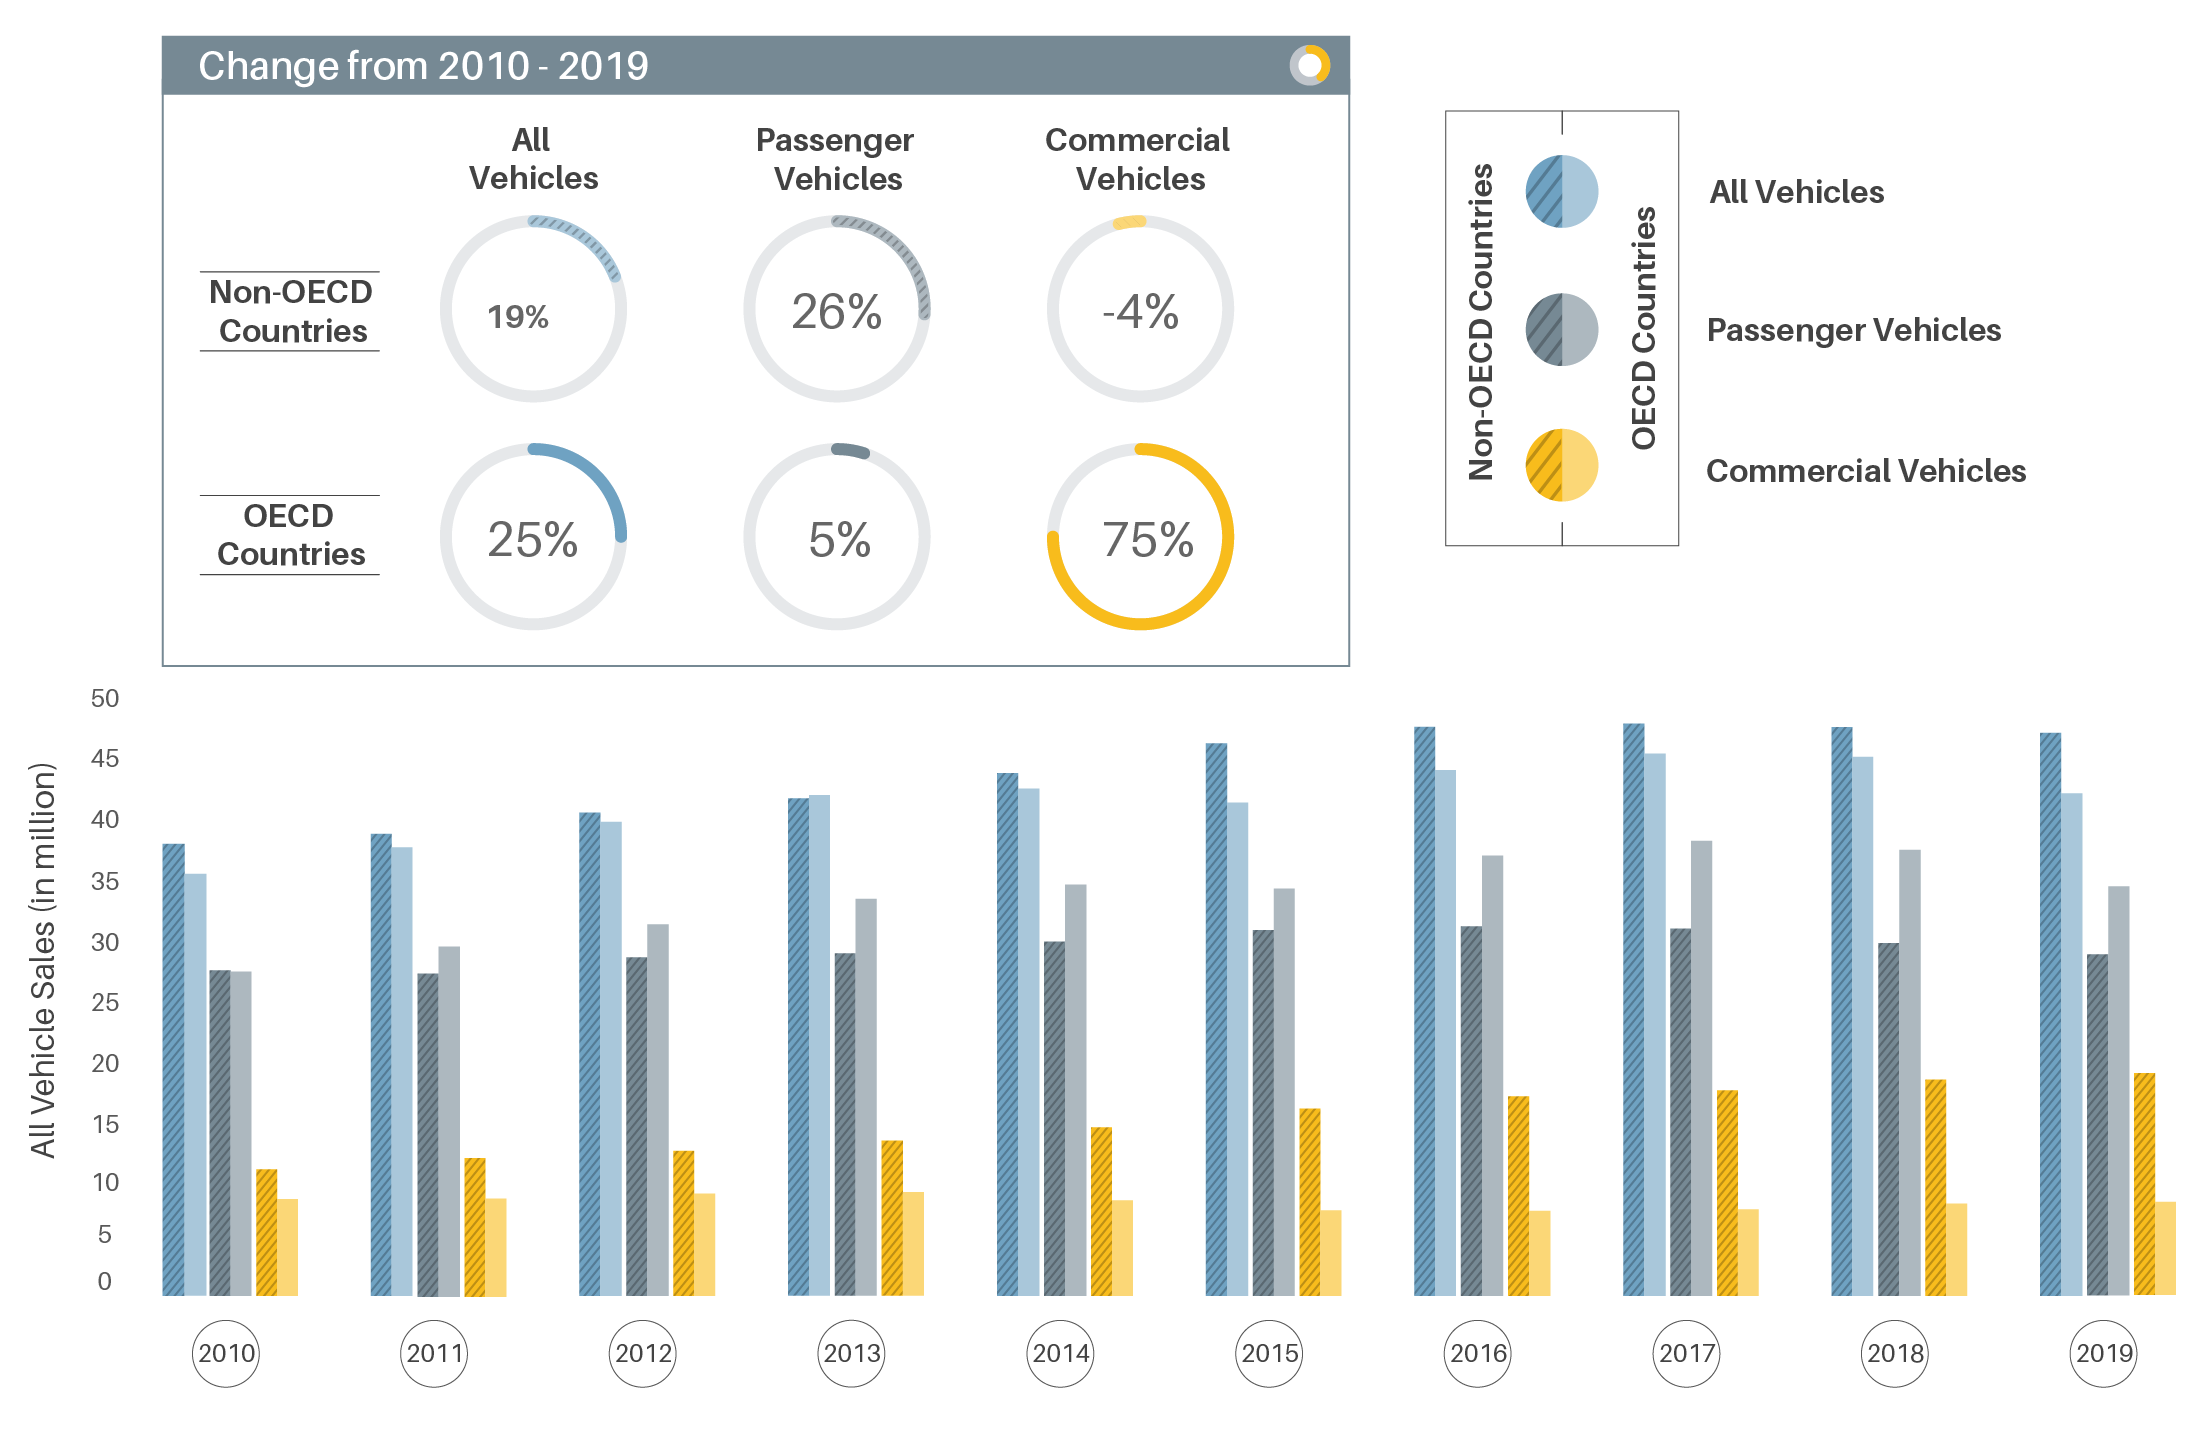
The long-anticipated possibility of “peak car” may now be arriving, due to rising urban congestion as well as expanding shared mobility options. Between 2017 and 2019, total sales of passenger cars fell 7% in member countries of the Organisation for Economic Co-operation and Development (OECD) and 10% in non-OECD countries.
Figure 5.
Vehicle sales in OECD and non-OECD countries, 2010-2019
Despite evidence of reduced car ownership in some cities, the growth in ridesharing appears to be correlated more strongly with a shift away from cycling, walking, taxis, and public transport, not necessarily car driving. A US study found that the introduction of ridesharing services in a city leads to annual decreases in heavy rail ridership of 1.3% and in bus ridership of 1.7%.
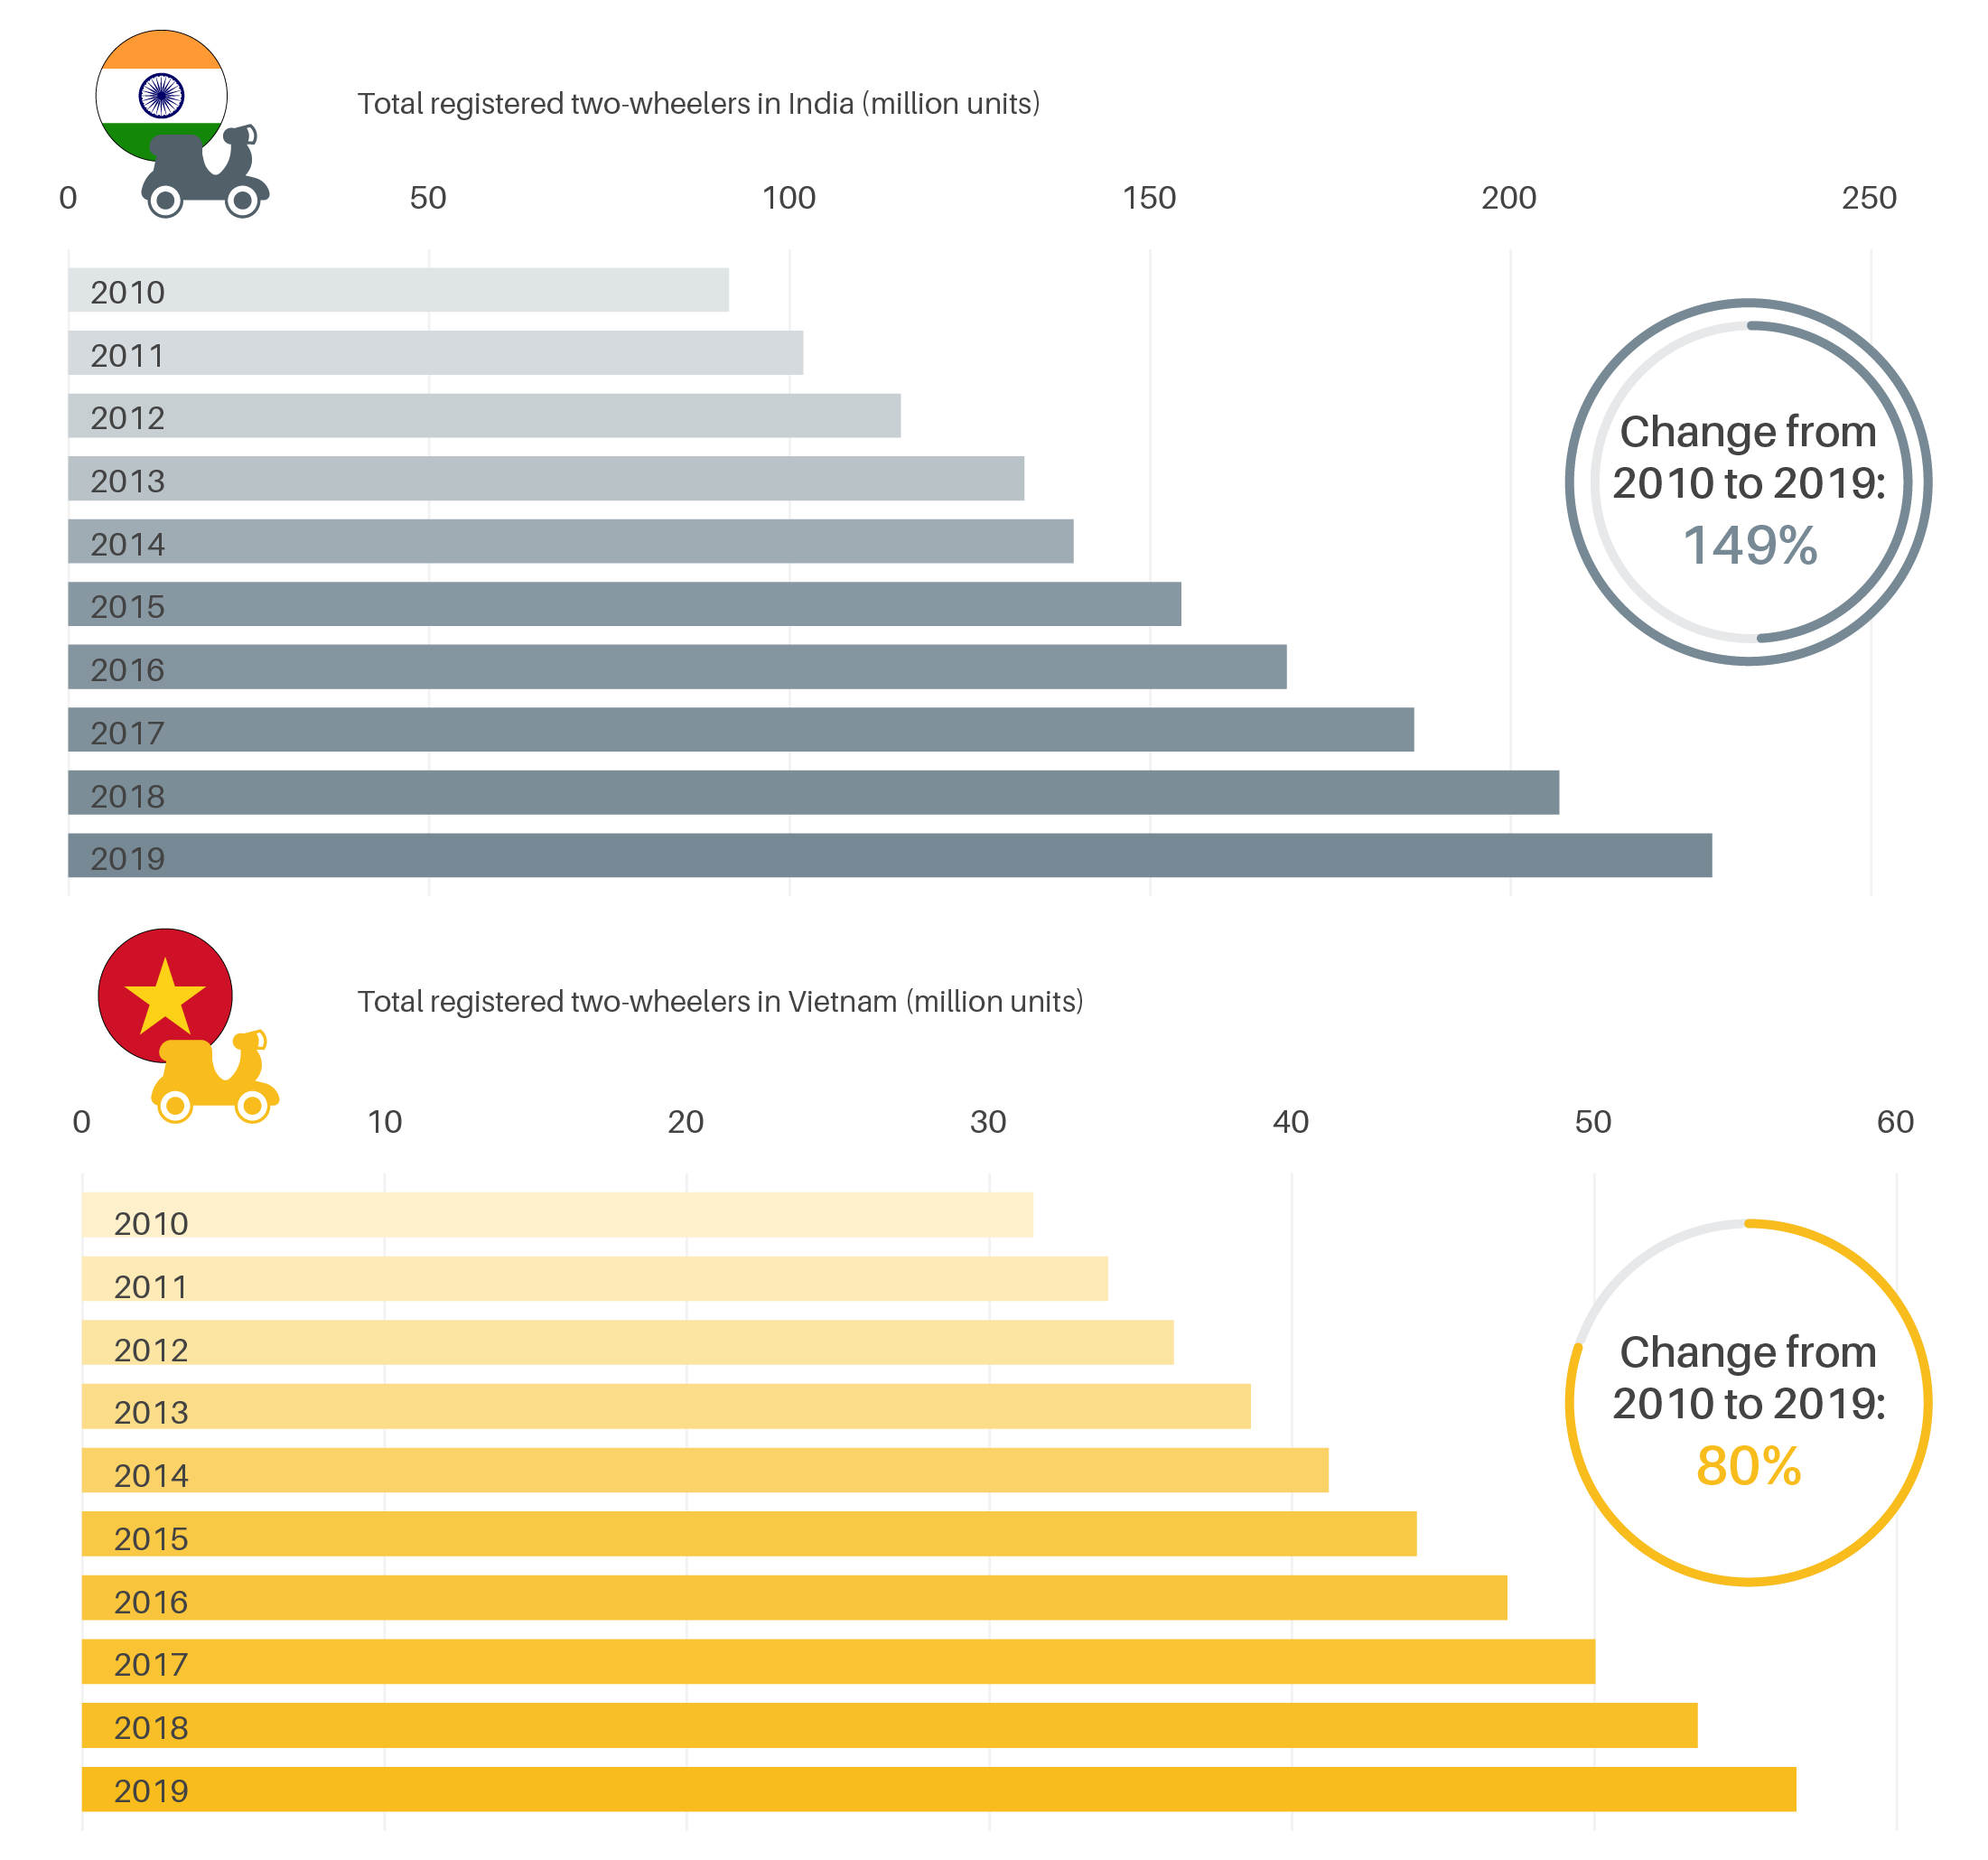
Motorised two-wheelers, such as mopeds and motorcycles, grew 149% in India and 80% in Vietnam between 2010 and 2019, and the world’s largest motorcycle fleets are in China, India, Indonesia, Pakistan and Vietnam. These transport modes are most prevalent in Southeast Asia and have also increased in Latin America and Sub-Saharan Africa.
Figure 6.
Growth of motorcycle fleet in India and Vietnam, 2010-2019
-
 Freight transport supply and demand
Although urban road freight accounted for only 1% of the total freight tonne-kilometres moved worldwide in 2015, it represented half of all road vehicle freight-kilometres, simply because urban loads are typically light but the travel is high frequency. Heavy rail carried 7% of all freight between cities in 2015.
Global freight demand saw modest growth in maritime trade and declines in aviation due to the slow economic growth in 2018 and 2019.
-
Impacts of the COVID-19 pandemic
Oil demand in 2020 was an estimated 8 million barrels per day lower than in 2019. Freight transport activity dropped an estimated 36% below projected levels, and carbon dioxide (CO2) emissions from freight transport fell 30% in 2020.
As the pandemic disrupted the supply chain, global vehicle production declined 14.5% in 2020, with 13 million fewer vehicles produced during the year. The drop was mostly in passenger car sales, whereas global sales of commercial vehicles fell by some 2.3 million. Only electric vehicles recorded strong growth, for a total of 11.2 million electric cars on the world’s roads in 2020 (surpassing 2019 estimates by some 1.9 million cars).
Bicycle sales in the US increased 62% between January and October 2020 (compared to the same period in 2019), and e-bike sales increased 144%. Eleven European countries saw an average 8% increase in cycling during 2020.

