Global Transport
and Climate Change
As global emissions from the transport sector continue to rise, gaining a better understanding of the specific sources of these emissions, and how to address them, is critical. Which sub-sectors, regions and actions are leading to the increase in emissions? And where is progress being made towards decarbonisation? This section highlights global transport demand and emission trends, comparing them broadly across regions and framing the policy responses through the “Avoid-Shift-Improve” framework.
Key Findings
-
Demand Trends
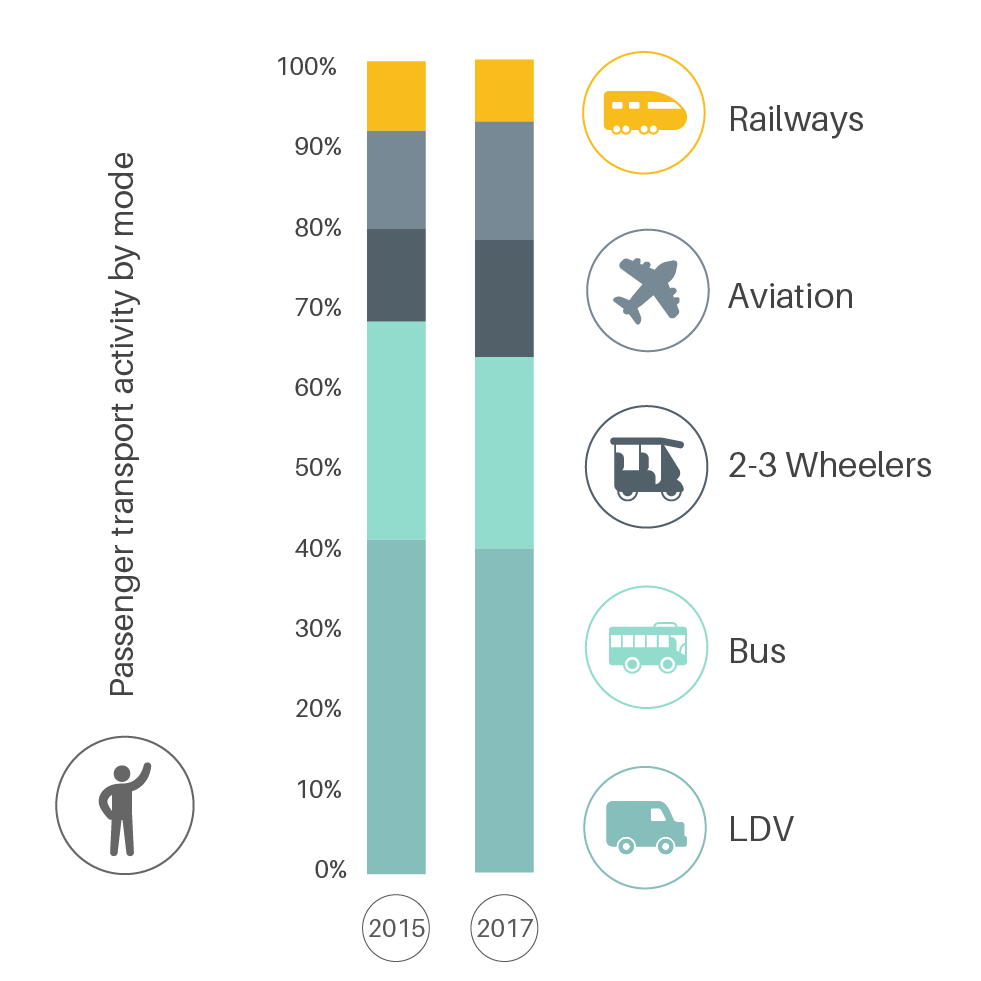
Global passenger transport demand remained at similar levels between 2015 and 2017. Road transport accounted for 78% of this demand in 2017.
Figure 1.
Share of passenger transport activity (passenger-kilometres) by mode,
2015 and 2017
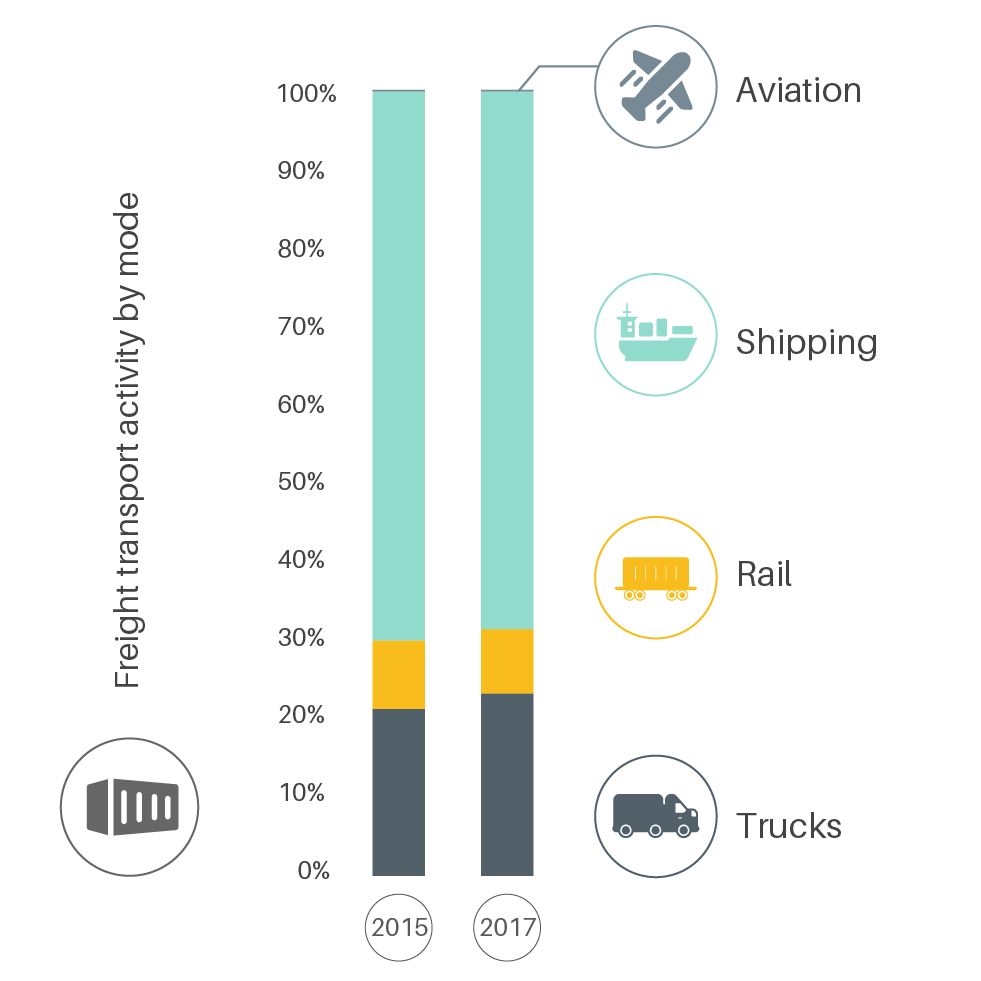
More goods than ever before are being transported on trucks as freight activity has continued to grow, surpassing 120 trillion tonne-kilometres in 2017.
Figure 2.
Share of freight transport activity (tonne-kilometres) by mode,
2015 and 2017
-
Emission Trends
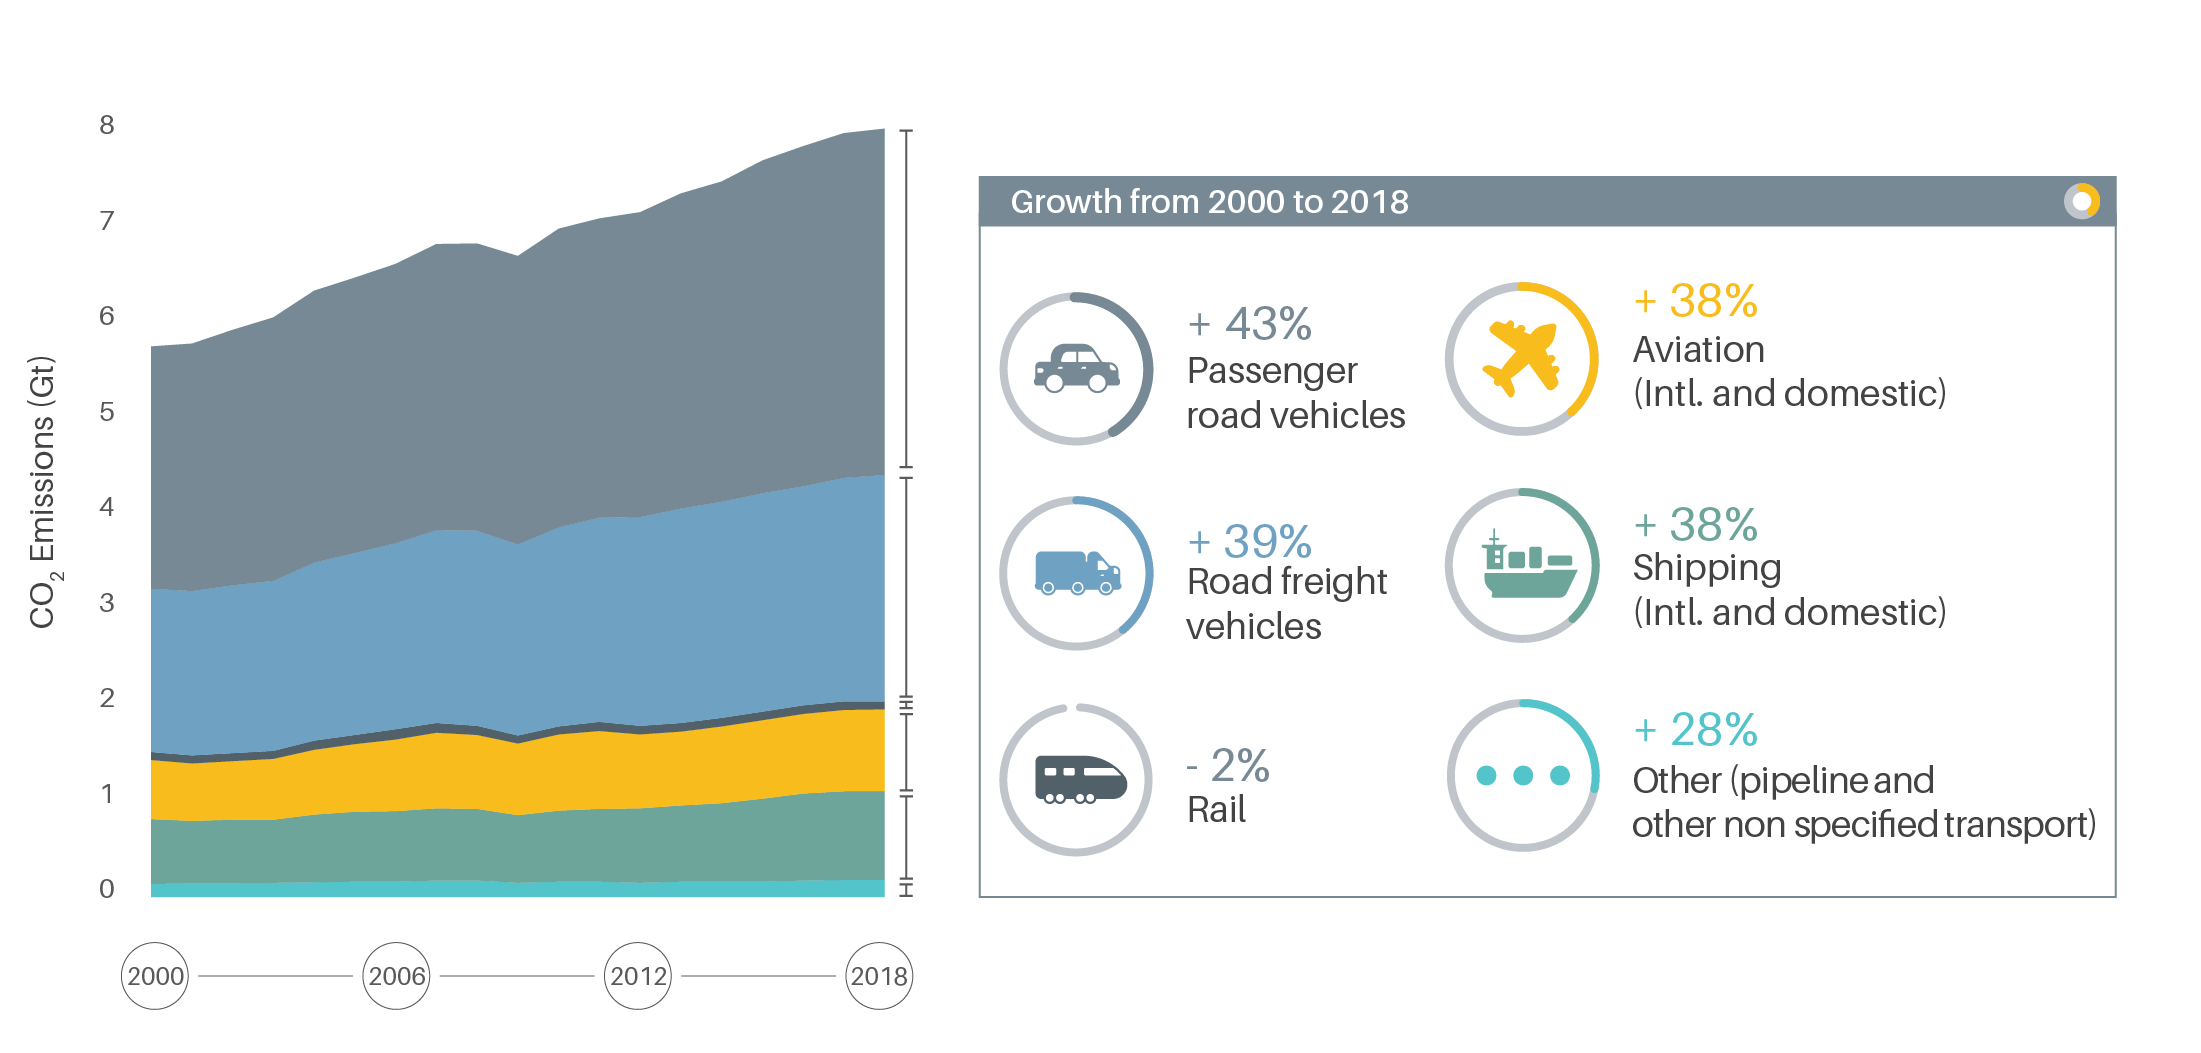
Figure 3.
Transport CO2 emissions by mode, 2000-2018
Transport accounted for 14% of total global greenhouse gas emissions in 2018.
Figure 4.
Greenhouse gas emissions from transport, by mode, 2018
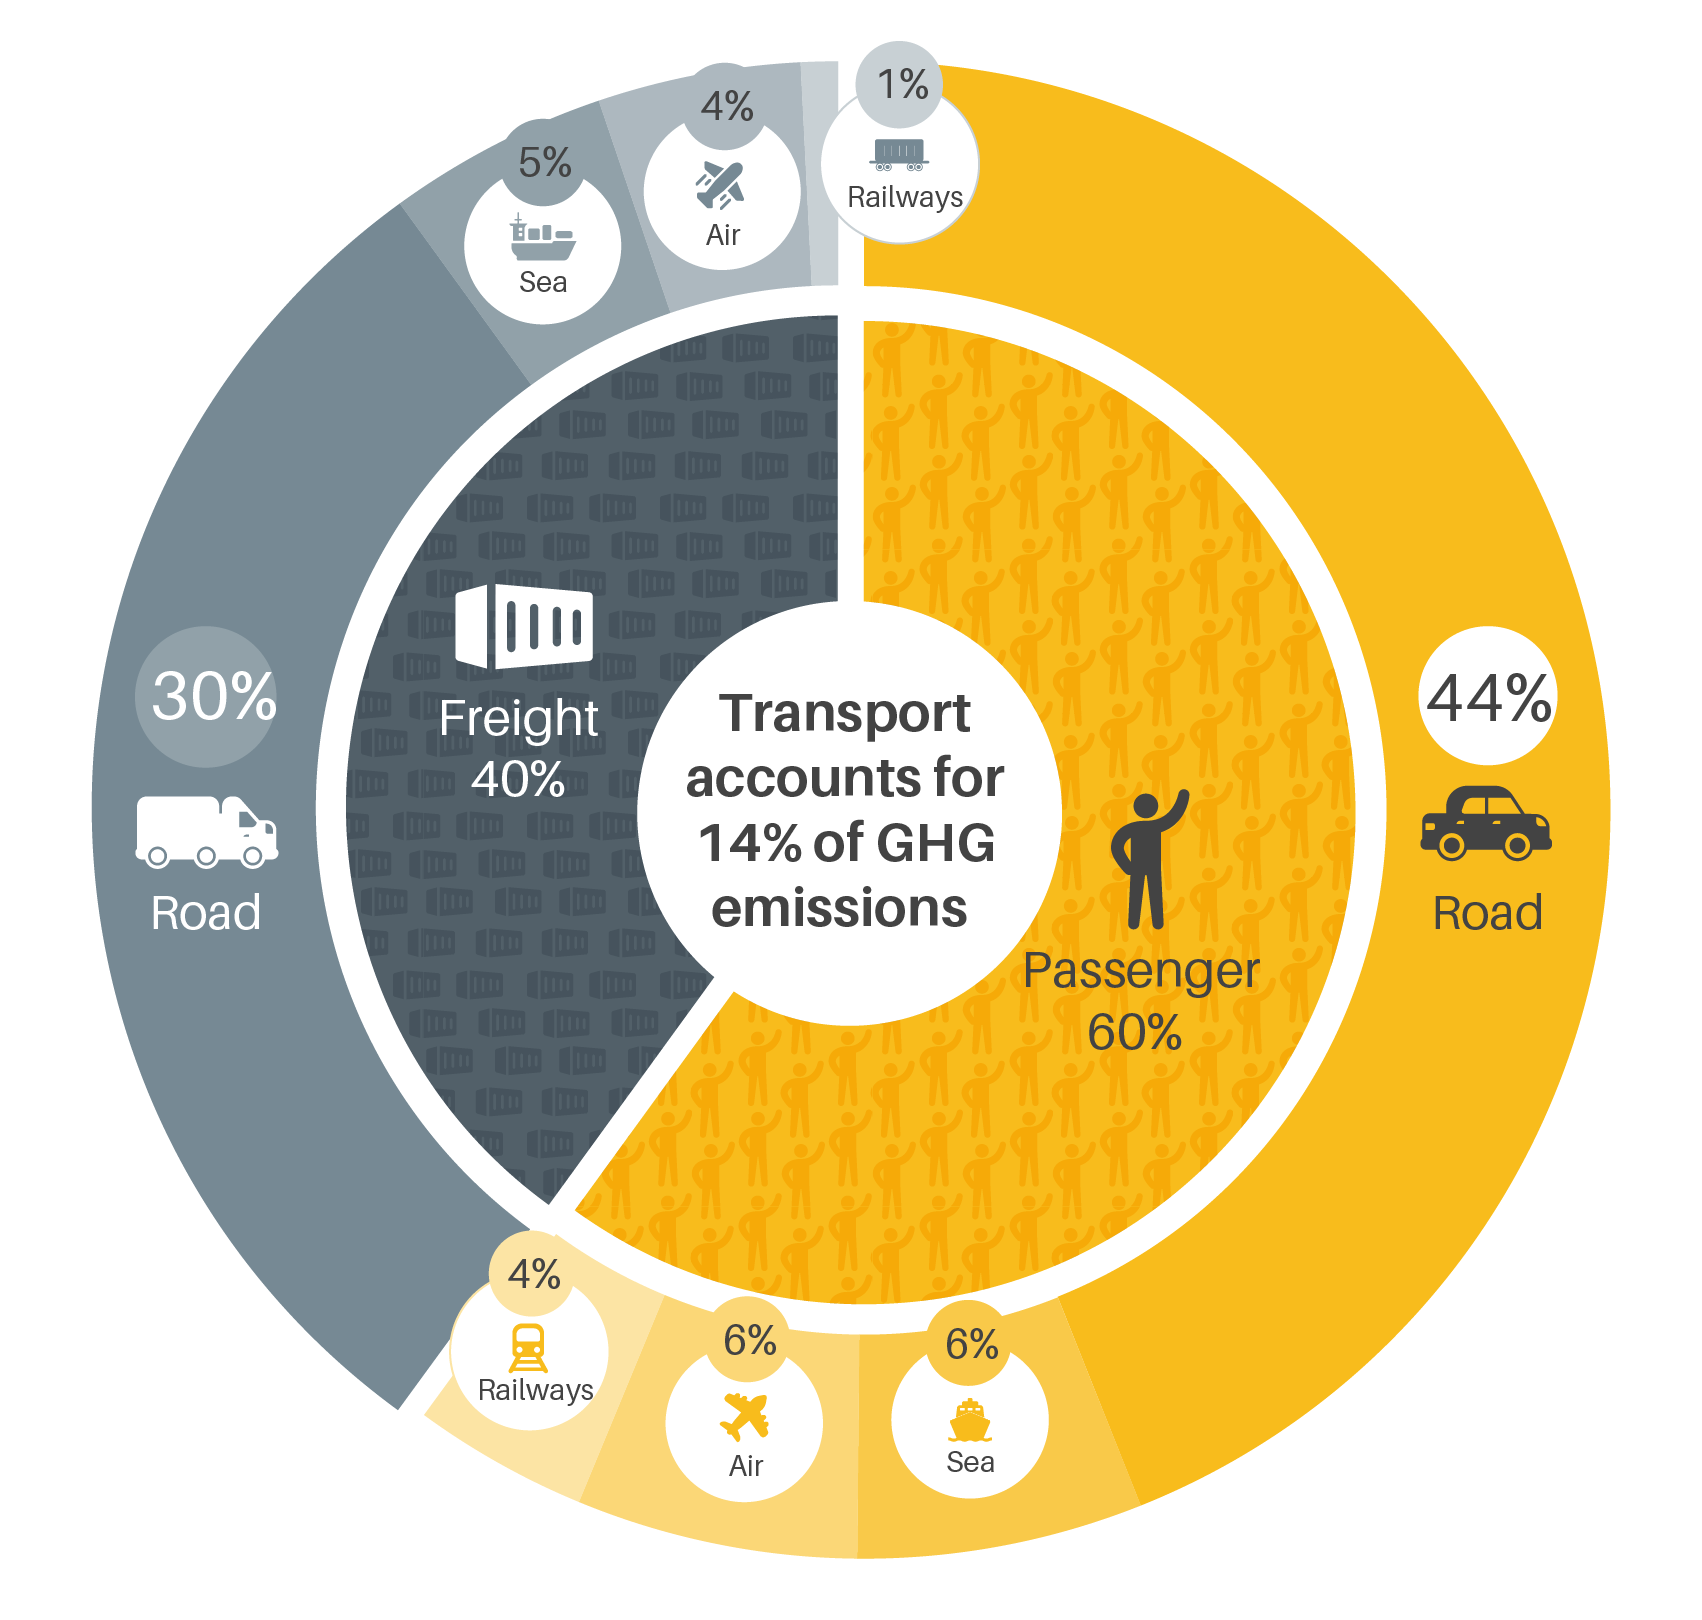
Road transport (both passenger and freight) contributed nearly three-quarters (74%) of transport greenhouse gas emissions that year, while rail represented only 5%.
Asia experienced the highest increase in transport CO2 emissions among world regions from 2010 to 2019, at 41%, while Europe’s emissions fell 2% during this period.
Figure 5.
Share of transport emissions by region and in international aviation and shipping, 2010-2019
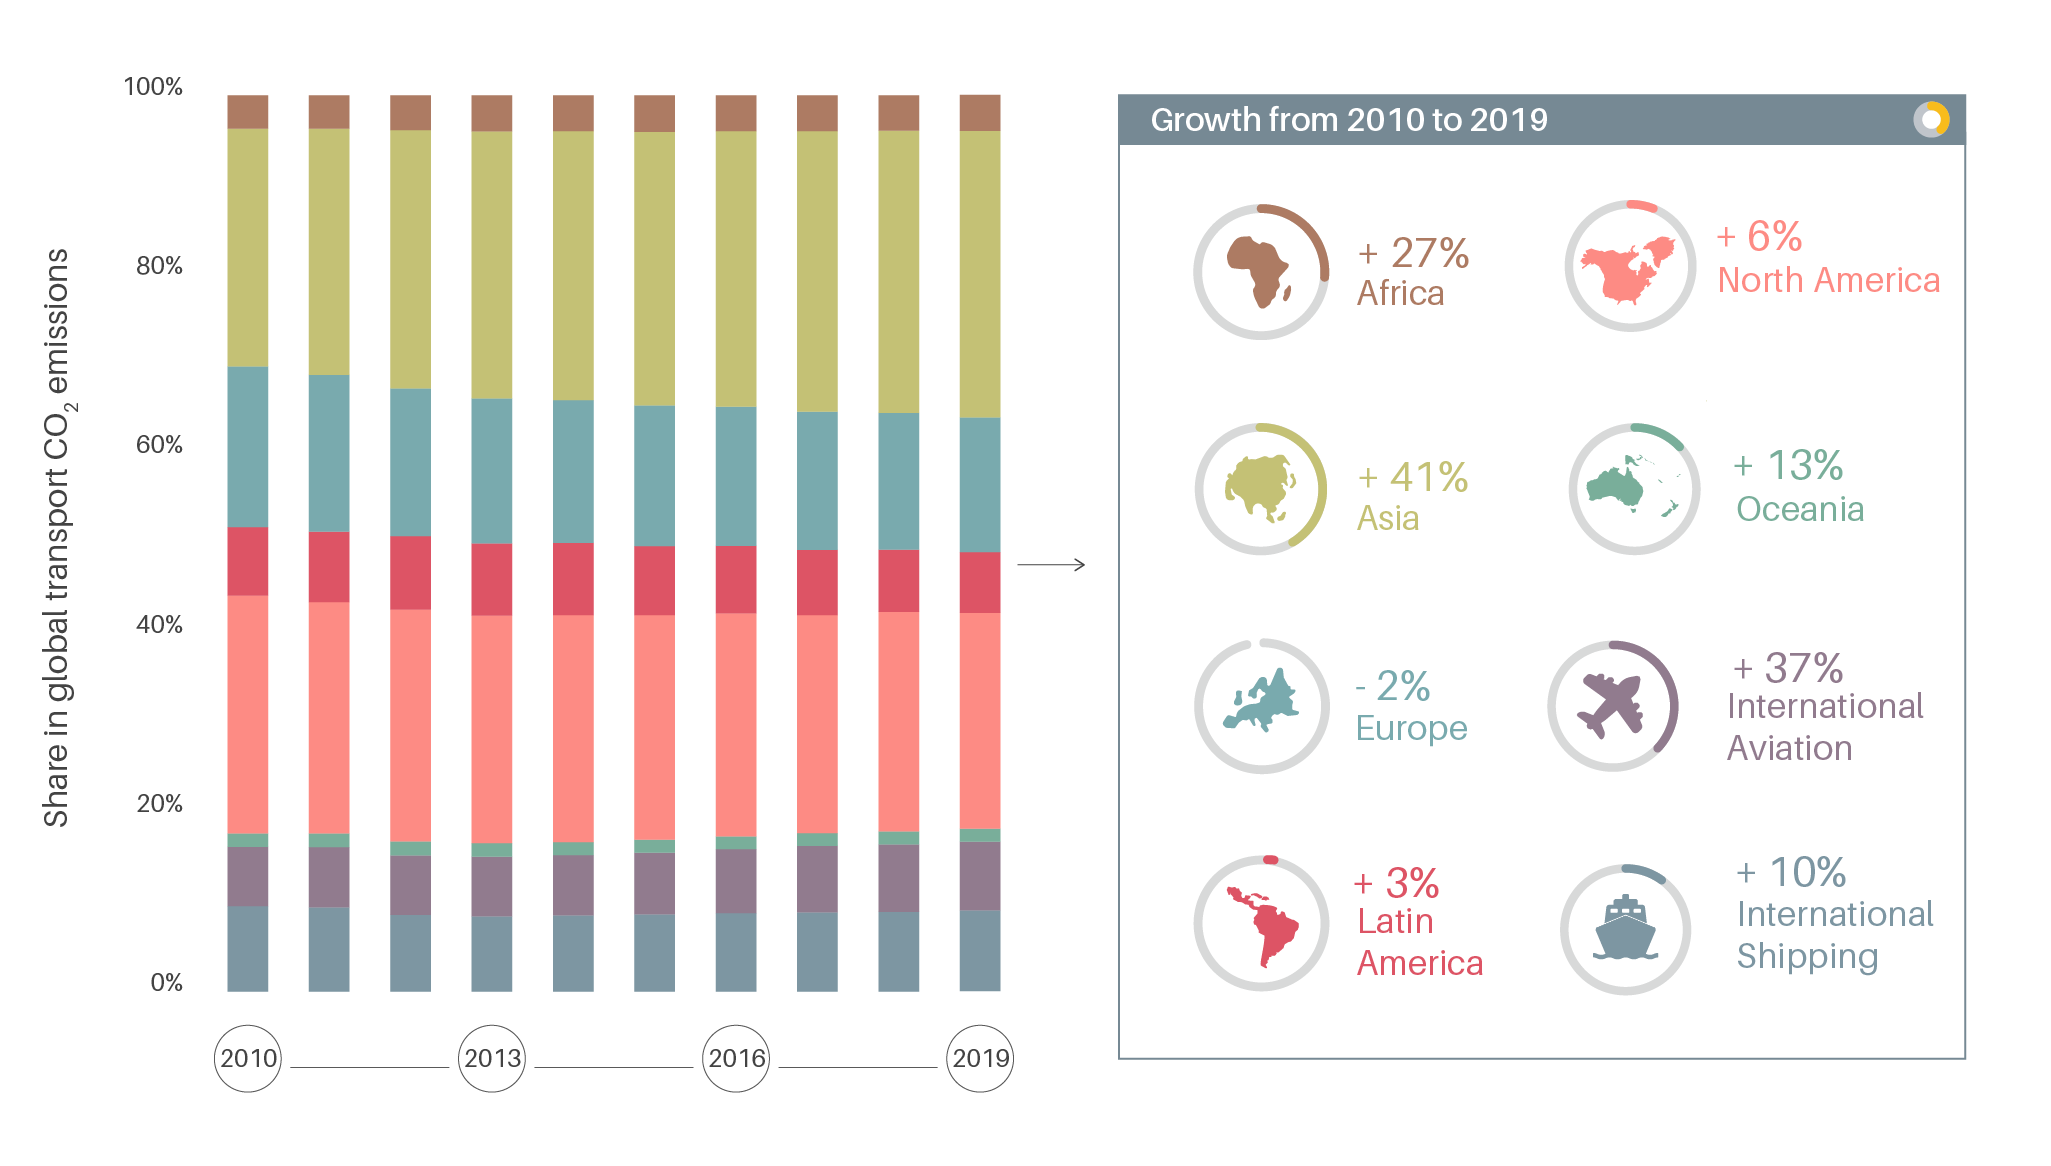
International aviation and shipping emissions both recorded double-digit growth between 2010 and 2019.
Figure 6.
Growth in transport emissions by region and in international aviation and shipping, 2000-2019
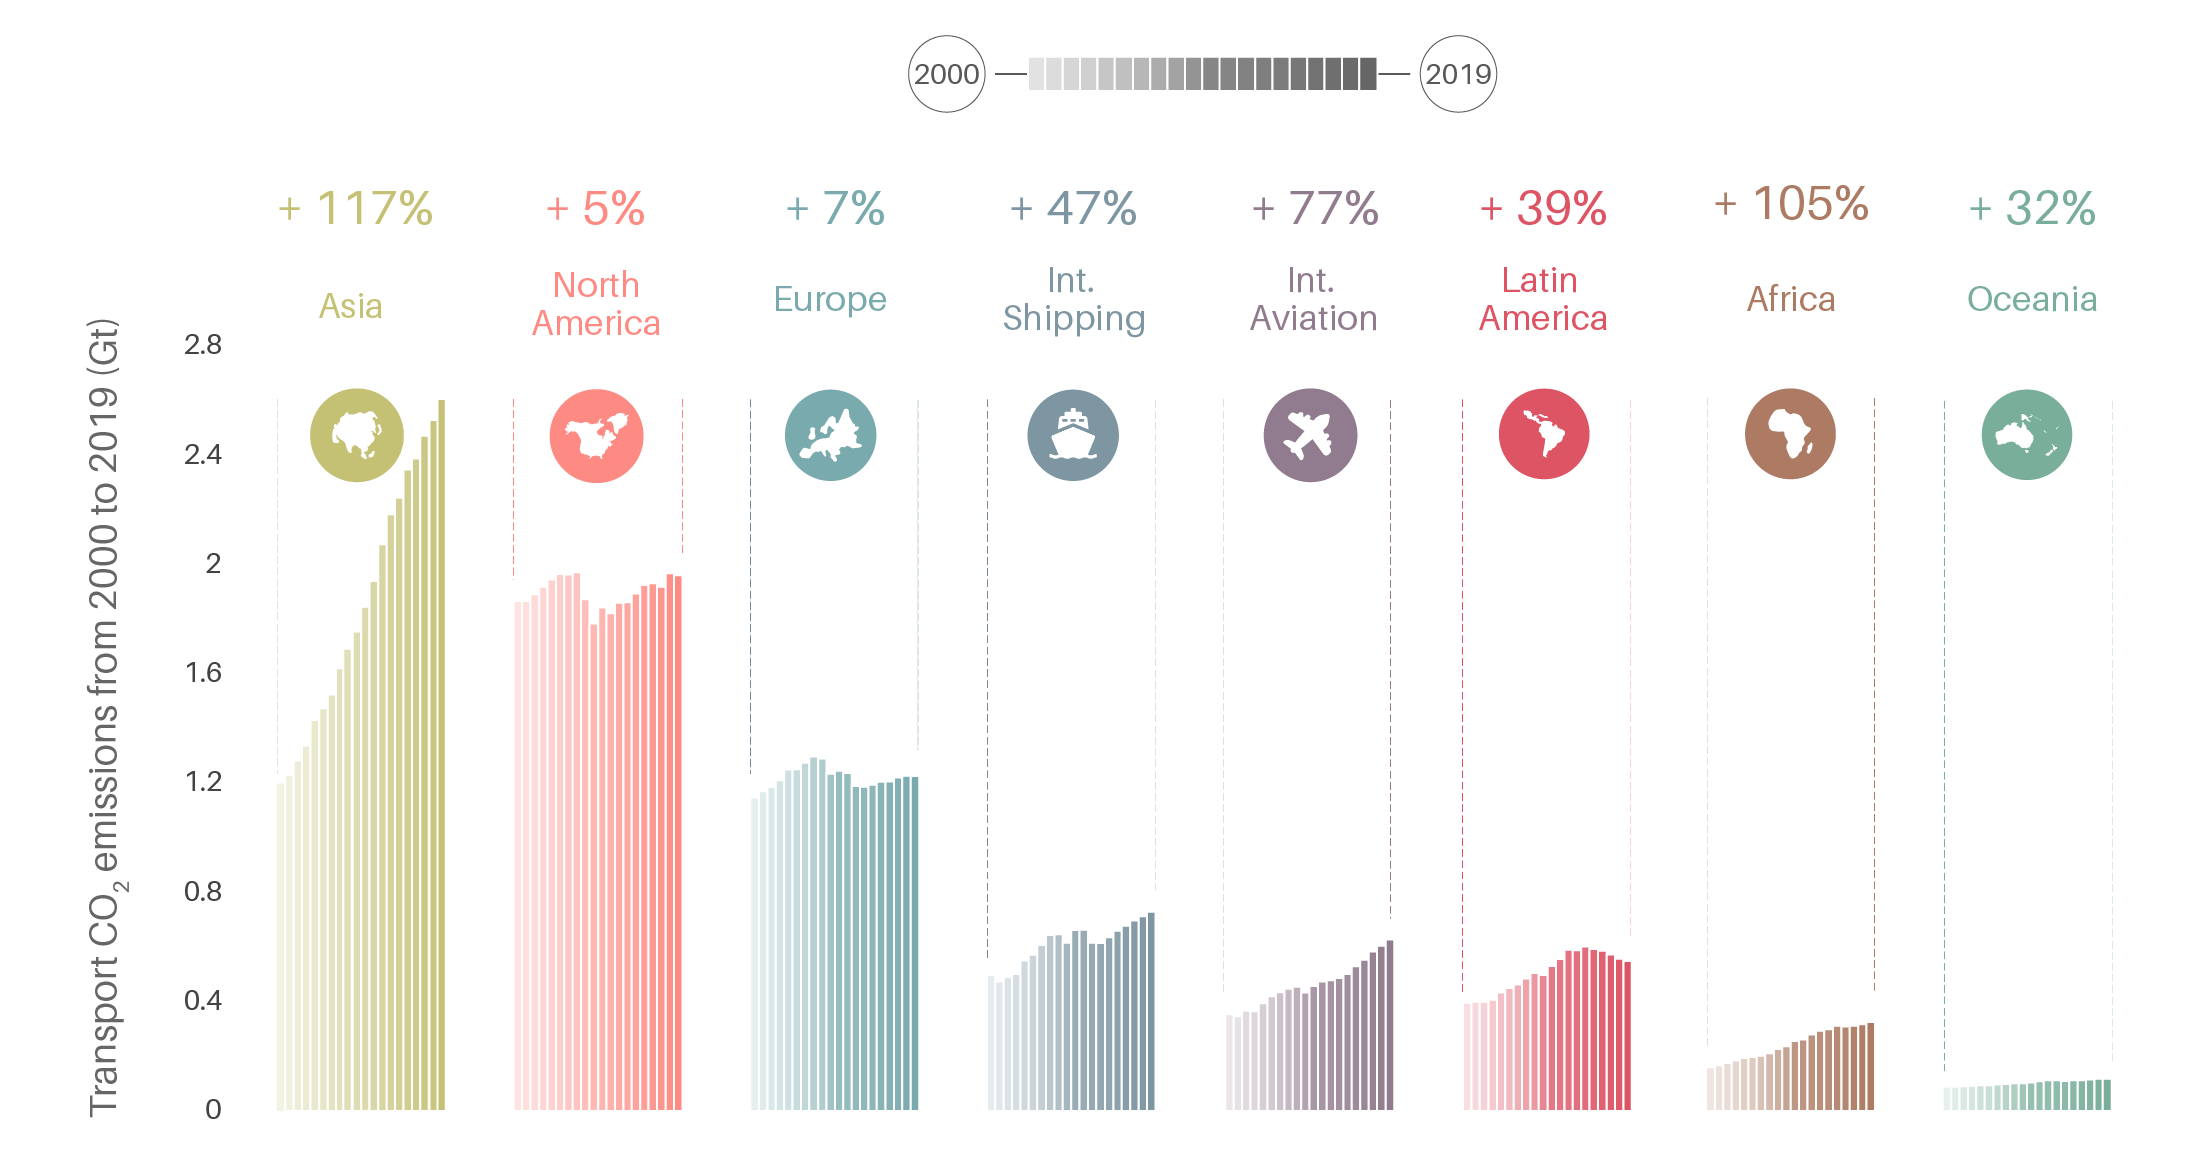
These two transport modes each emit more CO2 annually than the entire regions of Latin America and the Caribbean, Africa and Oceania.
Figure 7.
Emission growth in international aviation versus shipping
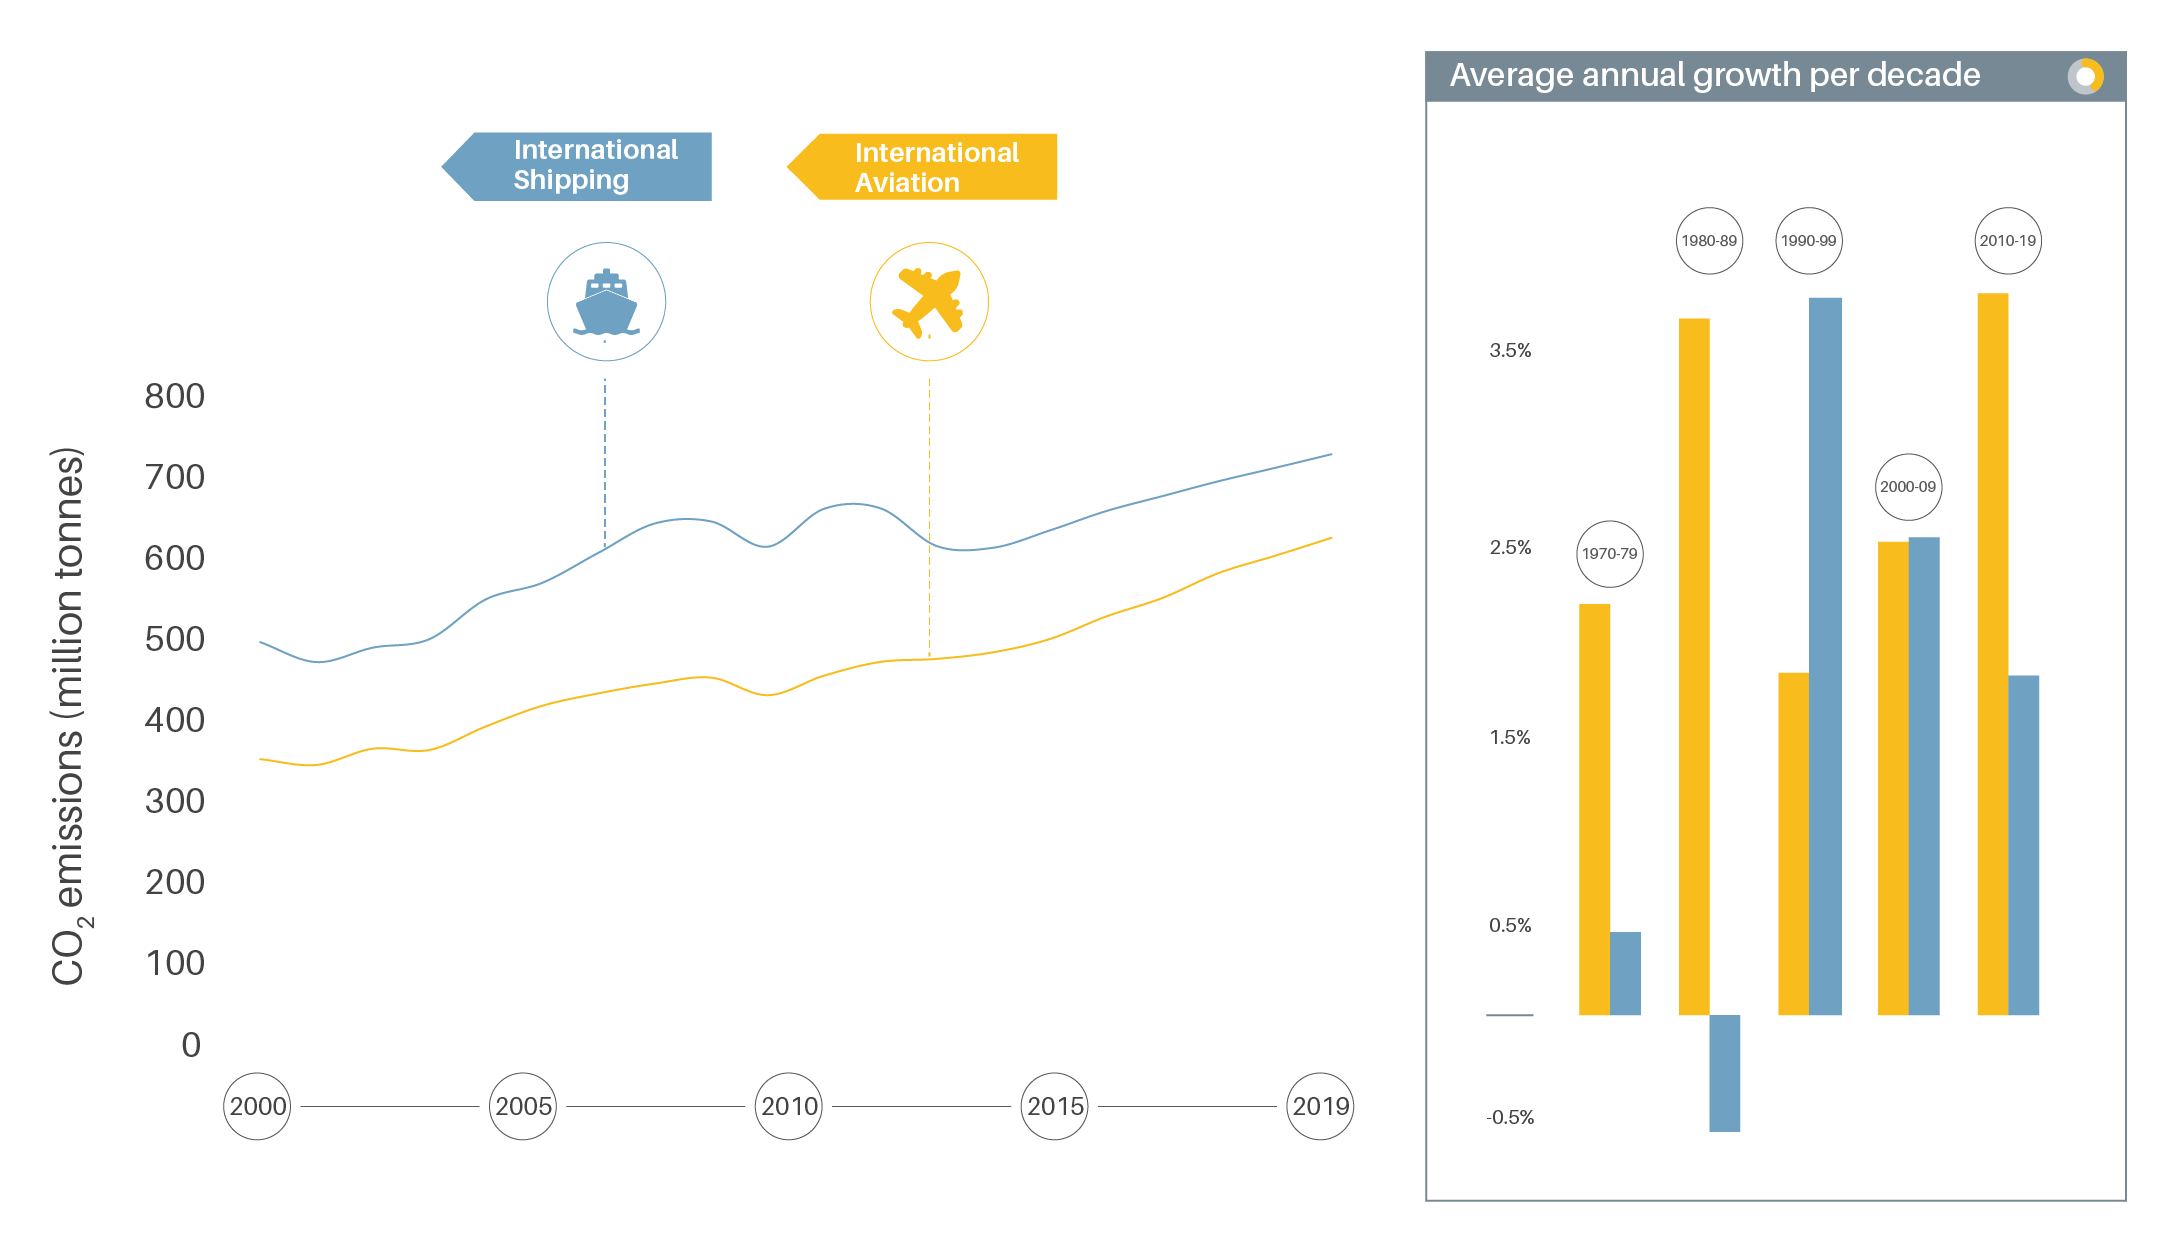
Emissions from maritime shipping have risen more slowly than those from aviation.
Between 2010 and 2019, annual growth in gross domestic product (GDP) averaged 2.9%, while transport CO2 emissions increased only 2.0%.
-
Policy Measures
Growing evidence shows that Avoid and Shift strategies can account for 40-60% of transport emission reductions, at lower costs than Improve strategies.
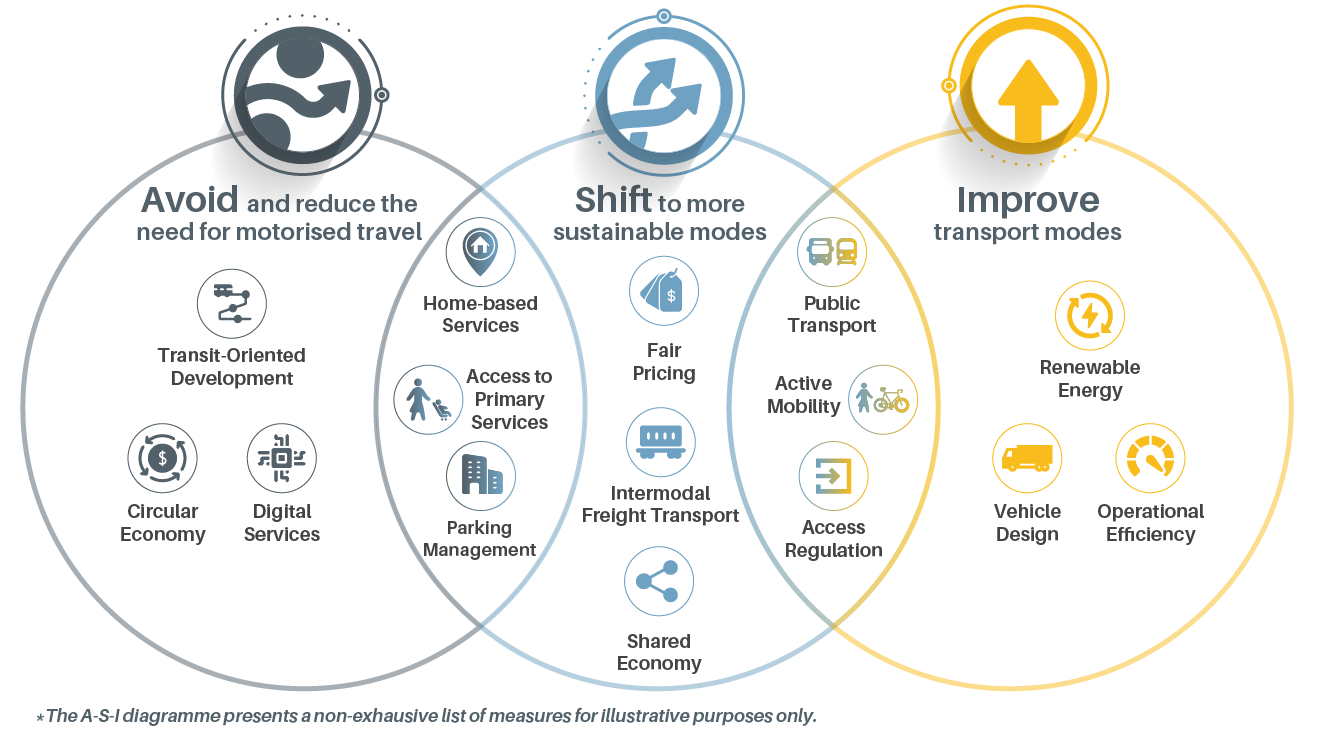
Countries’ updated Nationally Determined Contributions (NDCs) under the Paris Agreement continue to focus strongly on Improve measures, which represent 52% of all measures, whereas Shift measures account for 38% and Avoid measures for only 10%.
-
Impacts of the COVID-19 pandemic
In total, transport emissions declined by 1.5 gigatonnes of CO2 in 2020.
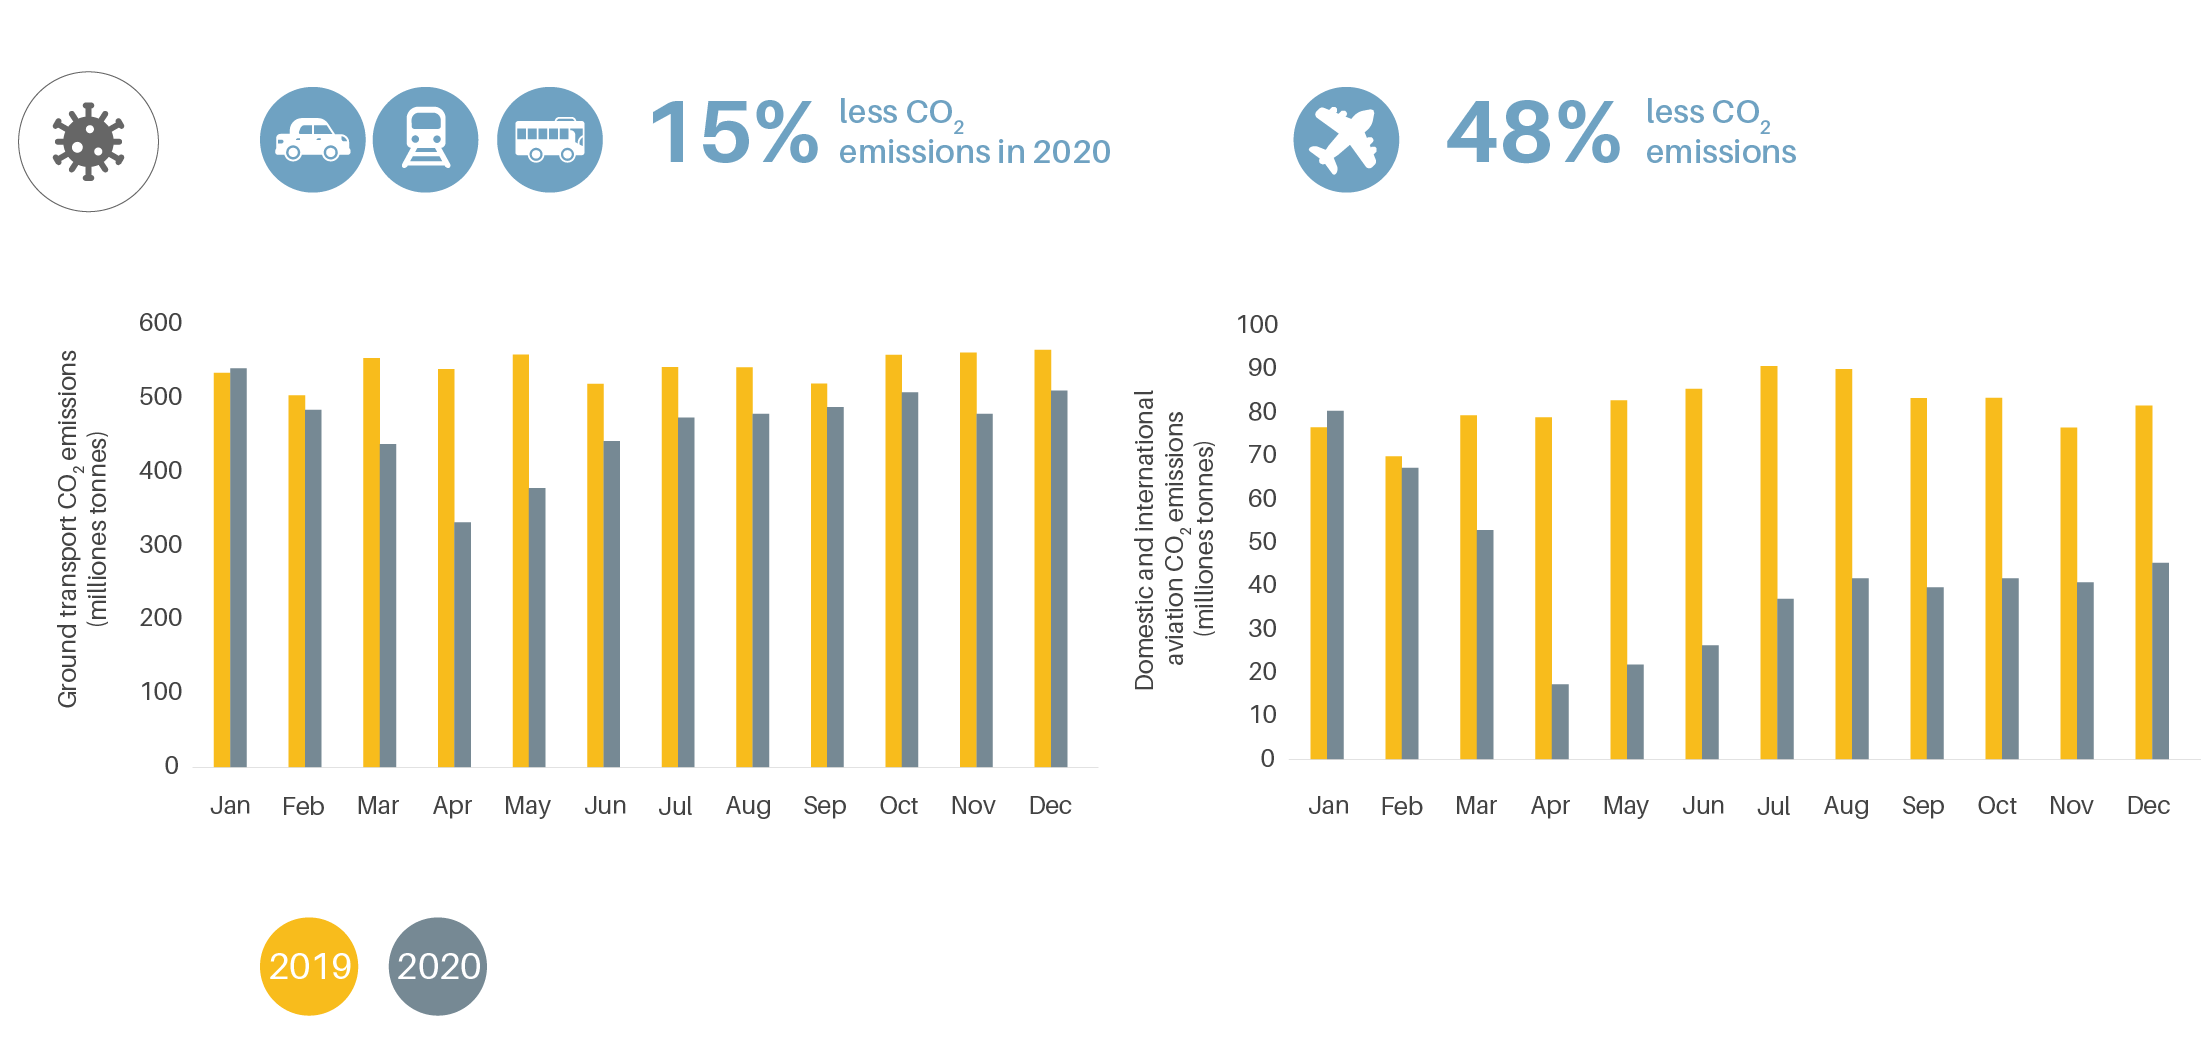
For the transport sector, CO2 emissions in 2020 fell 19.4% below 2019 levels, with emissions dropping 56.4% in international aviation, 31.9% in domestic aviation, 24.8% in international shipping and 14.6% in ground transport (road and railways).
Figure 10.
COVID-19 impacts on CO2 emissions from land transport and domestic aviation
Sales of new vehicles dropped 14.5% below 2019 levels in 2020.

