Shipping
Maritime shipping is the backbone of global trade, and international maritime transport caters almost exclusively to freight. Maritime transport accounts for more than 80% of global trade by volume and more than 70% by value. International shipping emits more CO2 annually than the entire regions of Latin America and the Caribbean, Africa or Oceania.ii Challenges to decarbonisation of the shipping sector include high initial investment costs for vessels as well as their long life spans.
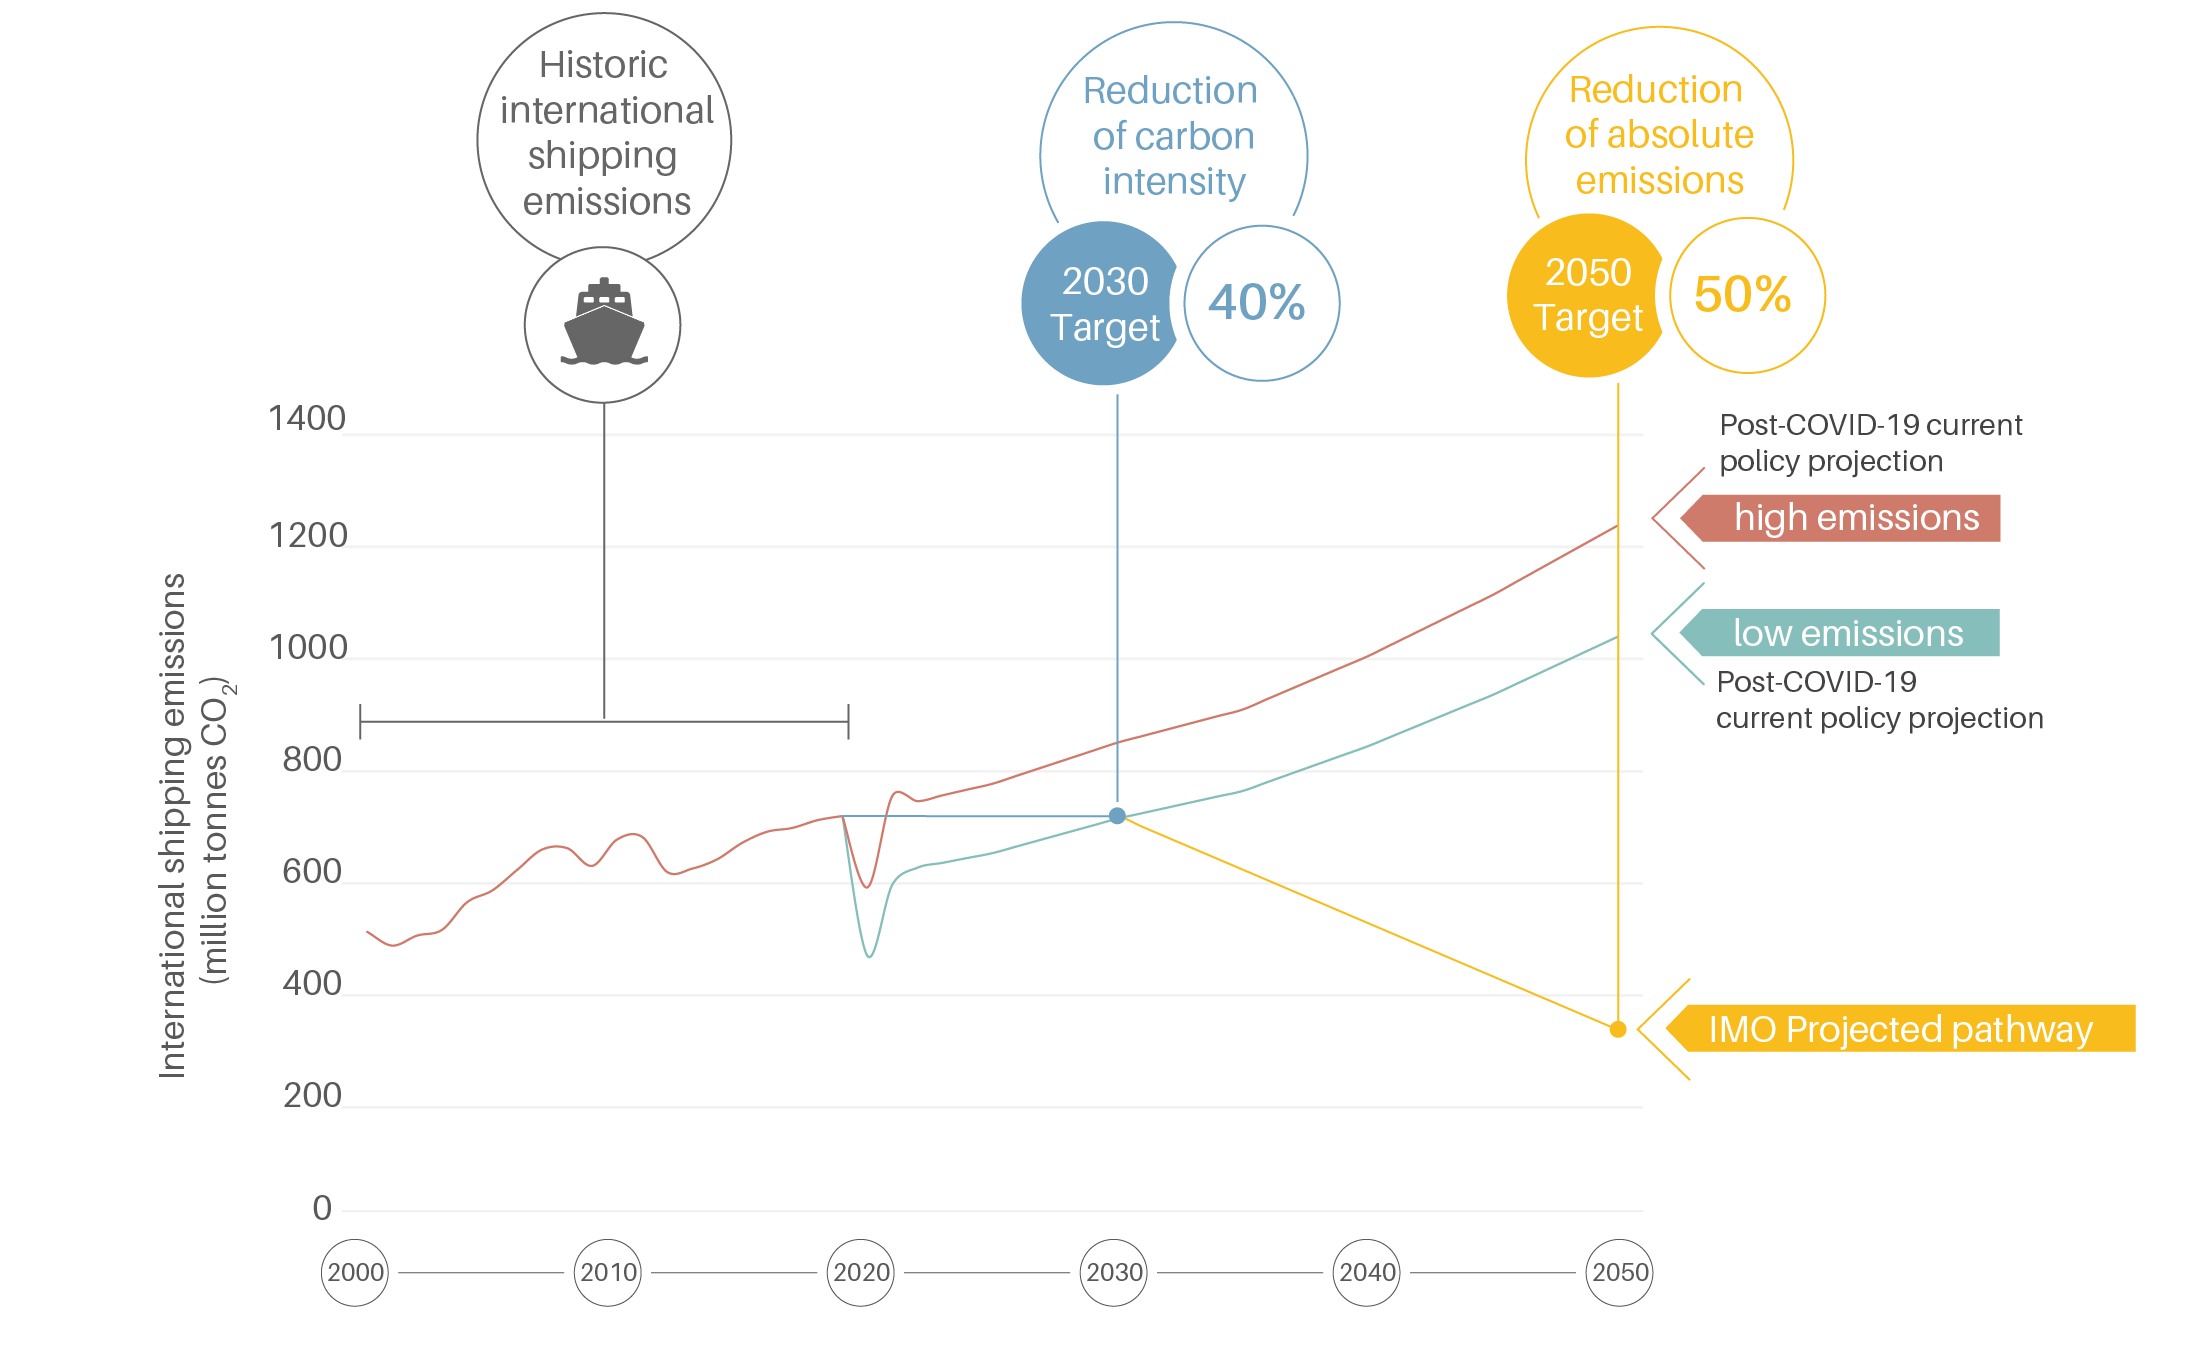
In 2018, the International Maritime Organization adopted targets to reduce the carbon intensity of shipping at least 40% by 2030 and to at least halve emissions by 2050; the baseline of these targets (2008) represents the historical height of shipping activity and thus a peak in the sector’s emissions. The IMO target aims for full decarbonisation as early as possible this century.
In early 2020, the IMO postponed a key session aimed at assessing measures to make progress towards the 2030 target and adopting a resolution urging Member States to develop voluntary National Action Plans.vi In 2020, the IMO agreed on implementing short-term emission reduction measures to achieve greenhouse gas emissions reductions before 2023.
Despite limited policy action, the shipping industry appears to have overachieved its 2030 carbon intensity target, which was rated “critically insufficient” by Climate Action Tracker even before the onset of the pandemic; however, the industry remains far from meeting its 2050 emission reduction target (which is rated “insufficient”).
The COVID-19 pandemic led to a brief halt in international maritime trade, and in the first six months of 2020 major routes experienced sharp declines in container-based trade. CO2 emissions from shipping declined between 18% and 35% for the year and are expected to only slowly return to pre-COVID-19 levels.
Key Findings
-
Demand trends
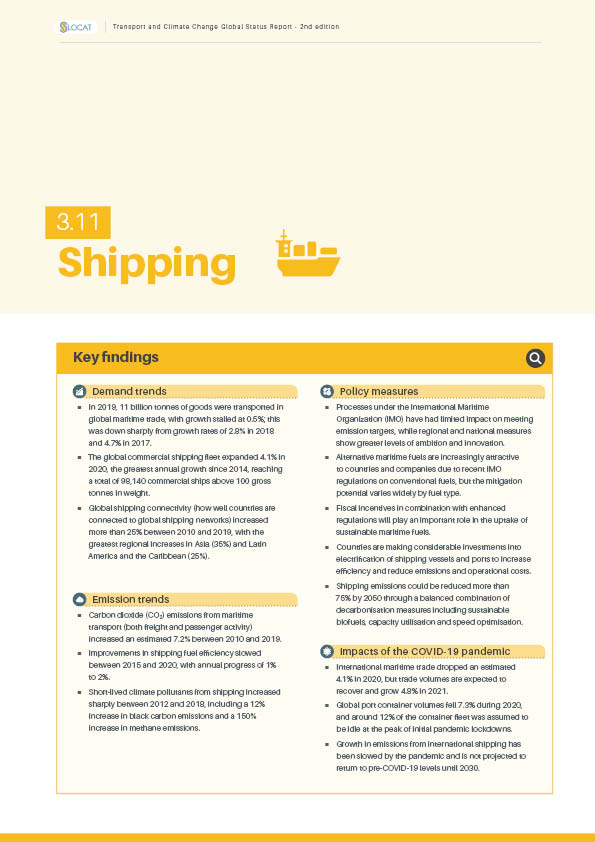
In 2019, 11 billion tonnes of goods were transported in global maritime trade, with growth stalled at 0.5%; this was down sharply from growth rates of 2.8% in 2018 and 4.7% in 2017.
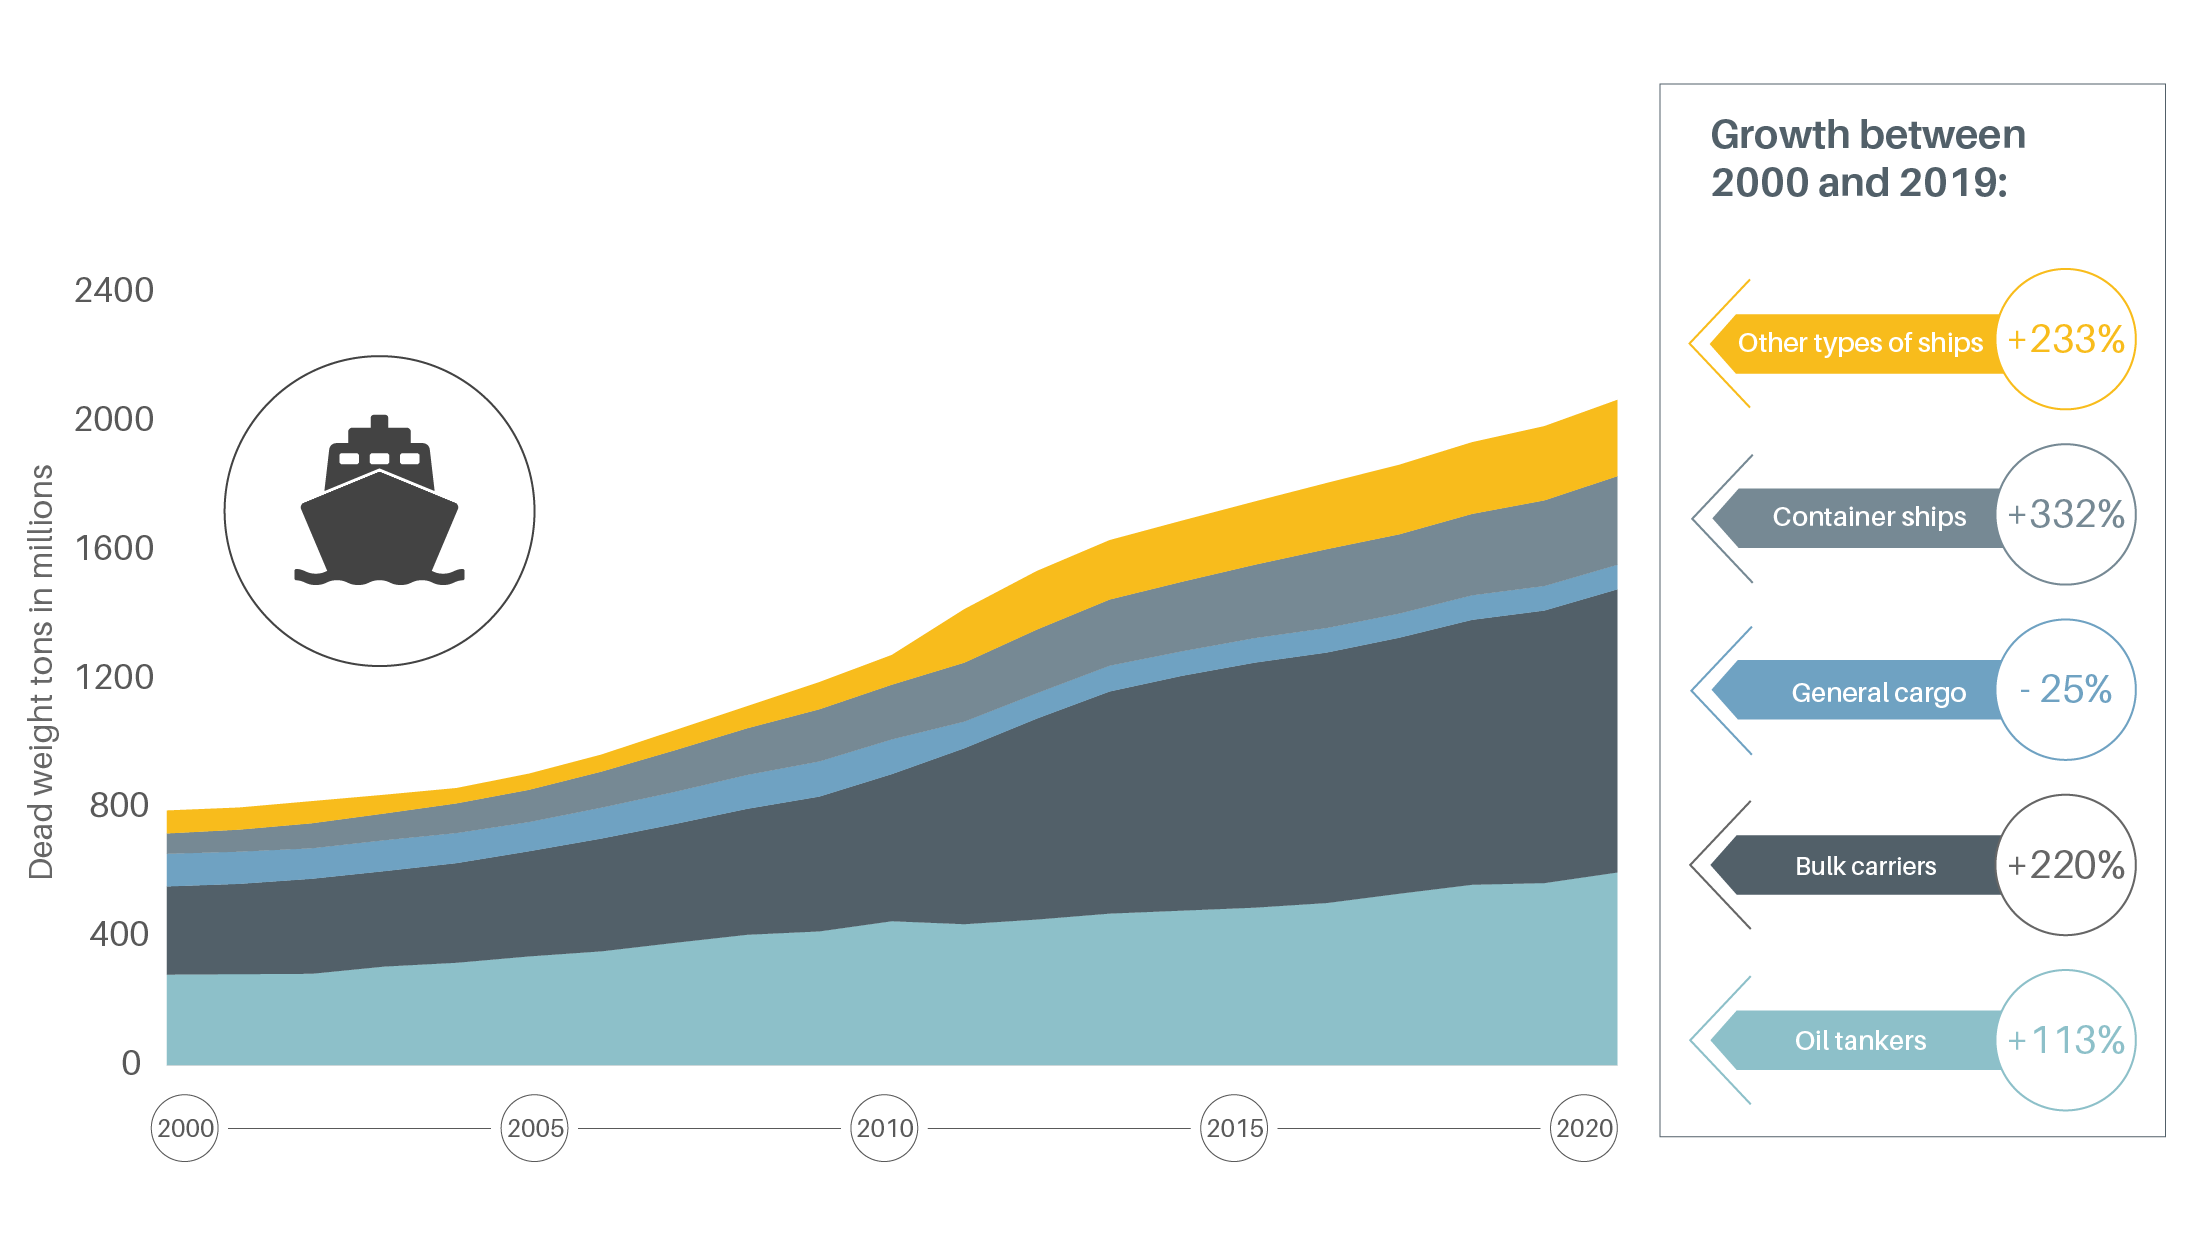
The global commercial shipping fleet expanded 4.1% in 2020, the greatest annual growth since 2014, reaching a total of 98,140 commercial ships above 100 gross tonnes in weight.
Figure 1.
World shipping fleet by principal vessel type, 2000-2020
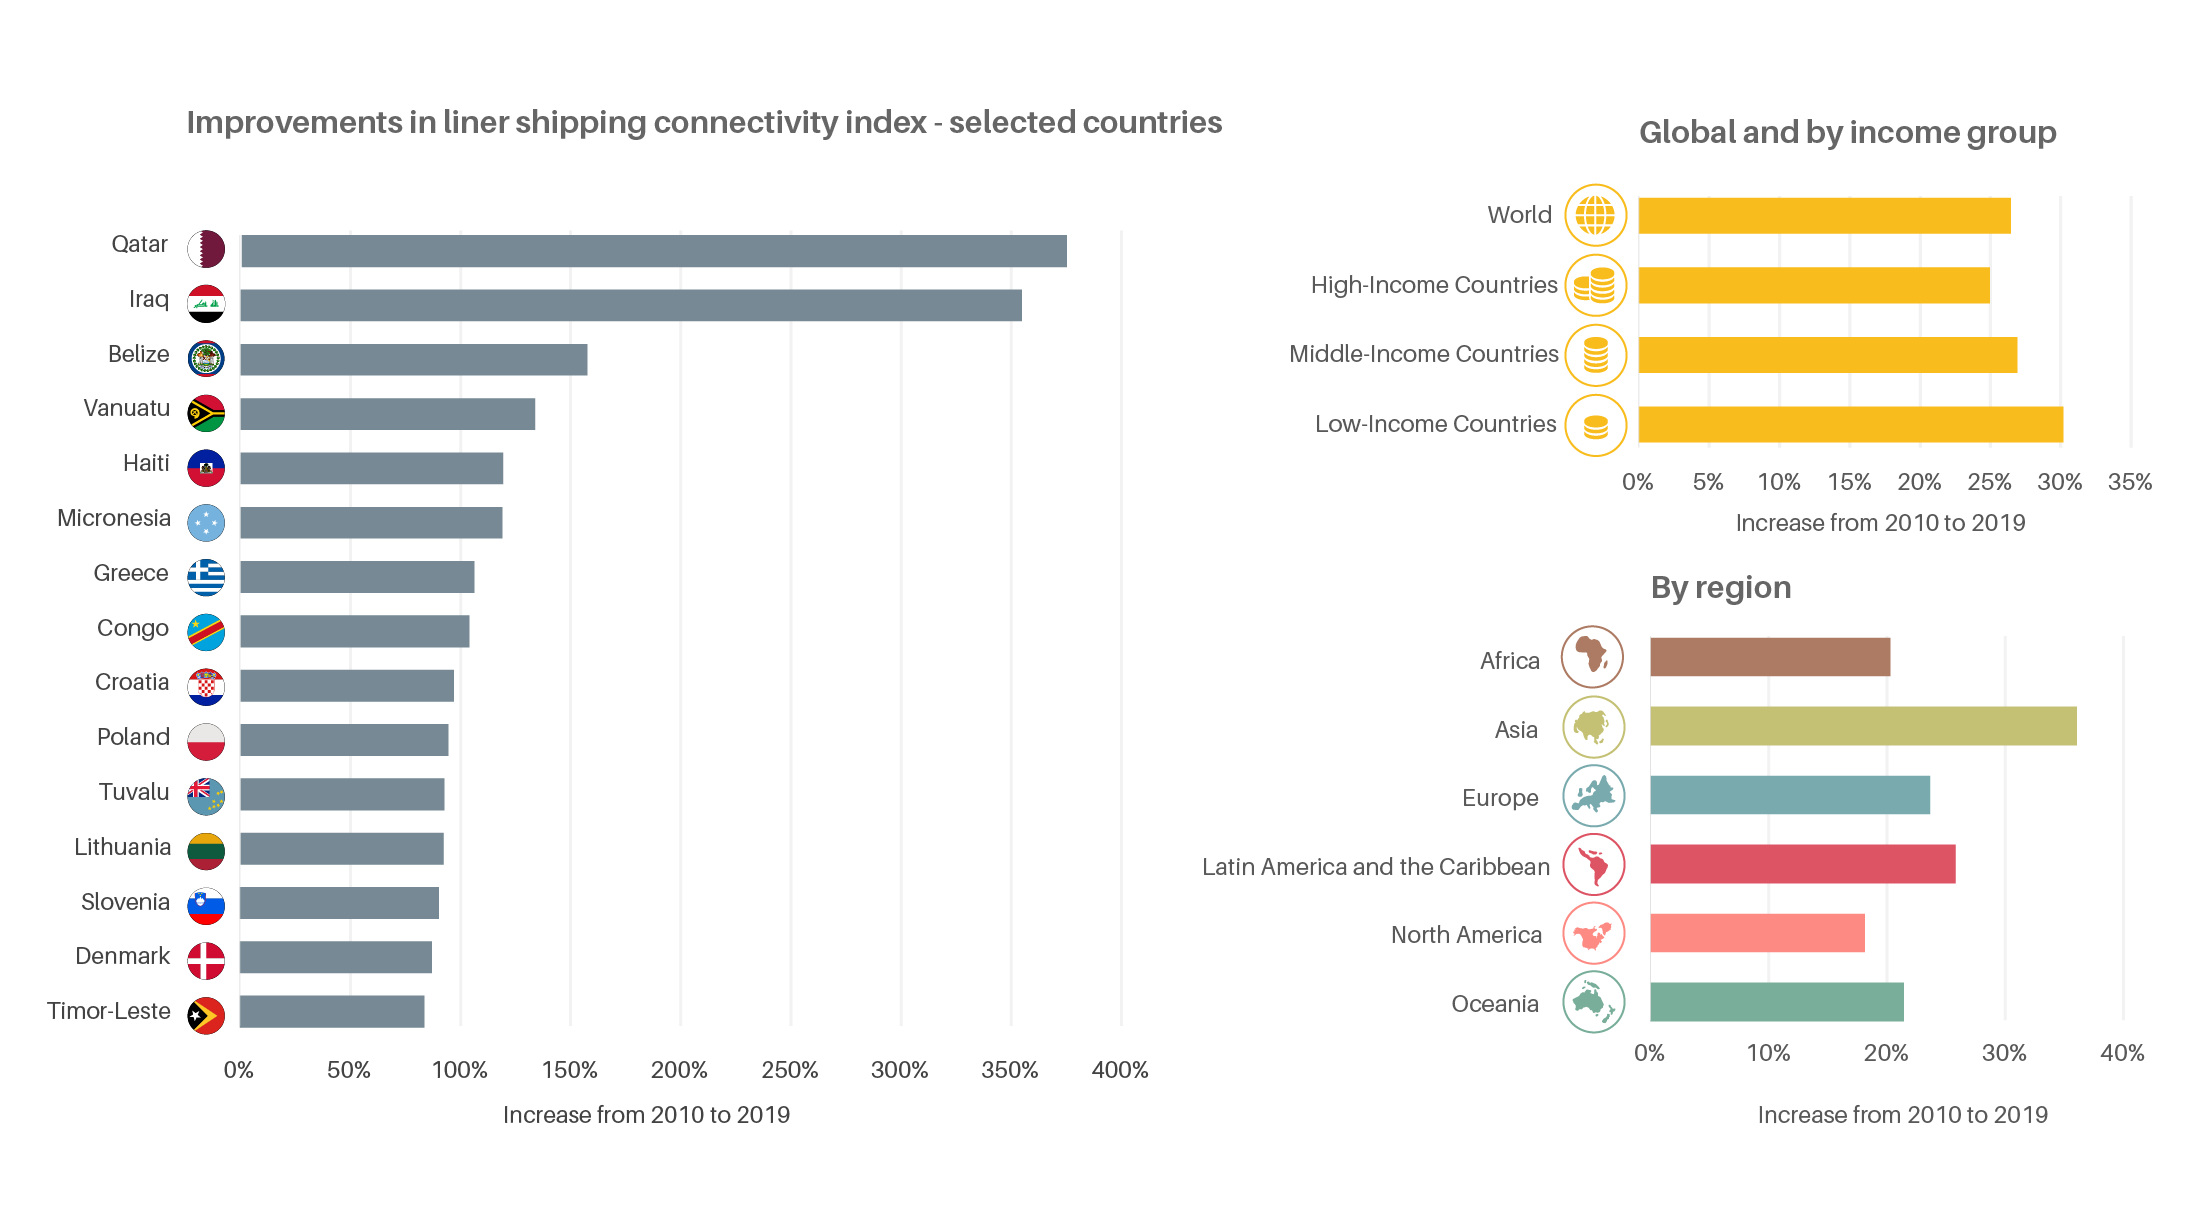
Global shipping connectivity (how well countries are connected to global shipping networks) increased more than 25% between 2010 and 2019, with the greatest regional increases in Asia (35%) and Latin America and the Caribbean (25%).
Figure 2.
Liner Shipping Connectivity Index, improvements by country and region, 2010-2019
-
Emission trends
Carbon dioxide (CO2) emissions from maritime transport (both freight and passenger activity) increased an estimated 7.2% between 2010 and 2019.
Improvements in shipping fuel efficiency slowed between 2015 and 2020, with annual progress of 1% to 2%.
Short-lived climate pollutants from shipping increased sharply between 2012 and 2018, including a 12% increase in black carbon emissions and a 150% increase in methane emissions.
-
Policy Measures
Processes under the International Maritime Organization (IMO) have had limited impact on meeting emission targets, while regional and national measures show greater levels of ambition and innovation.
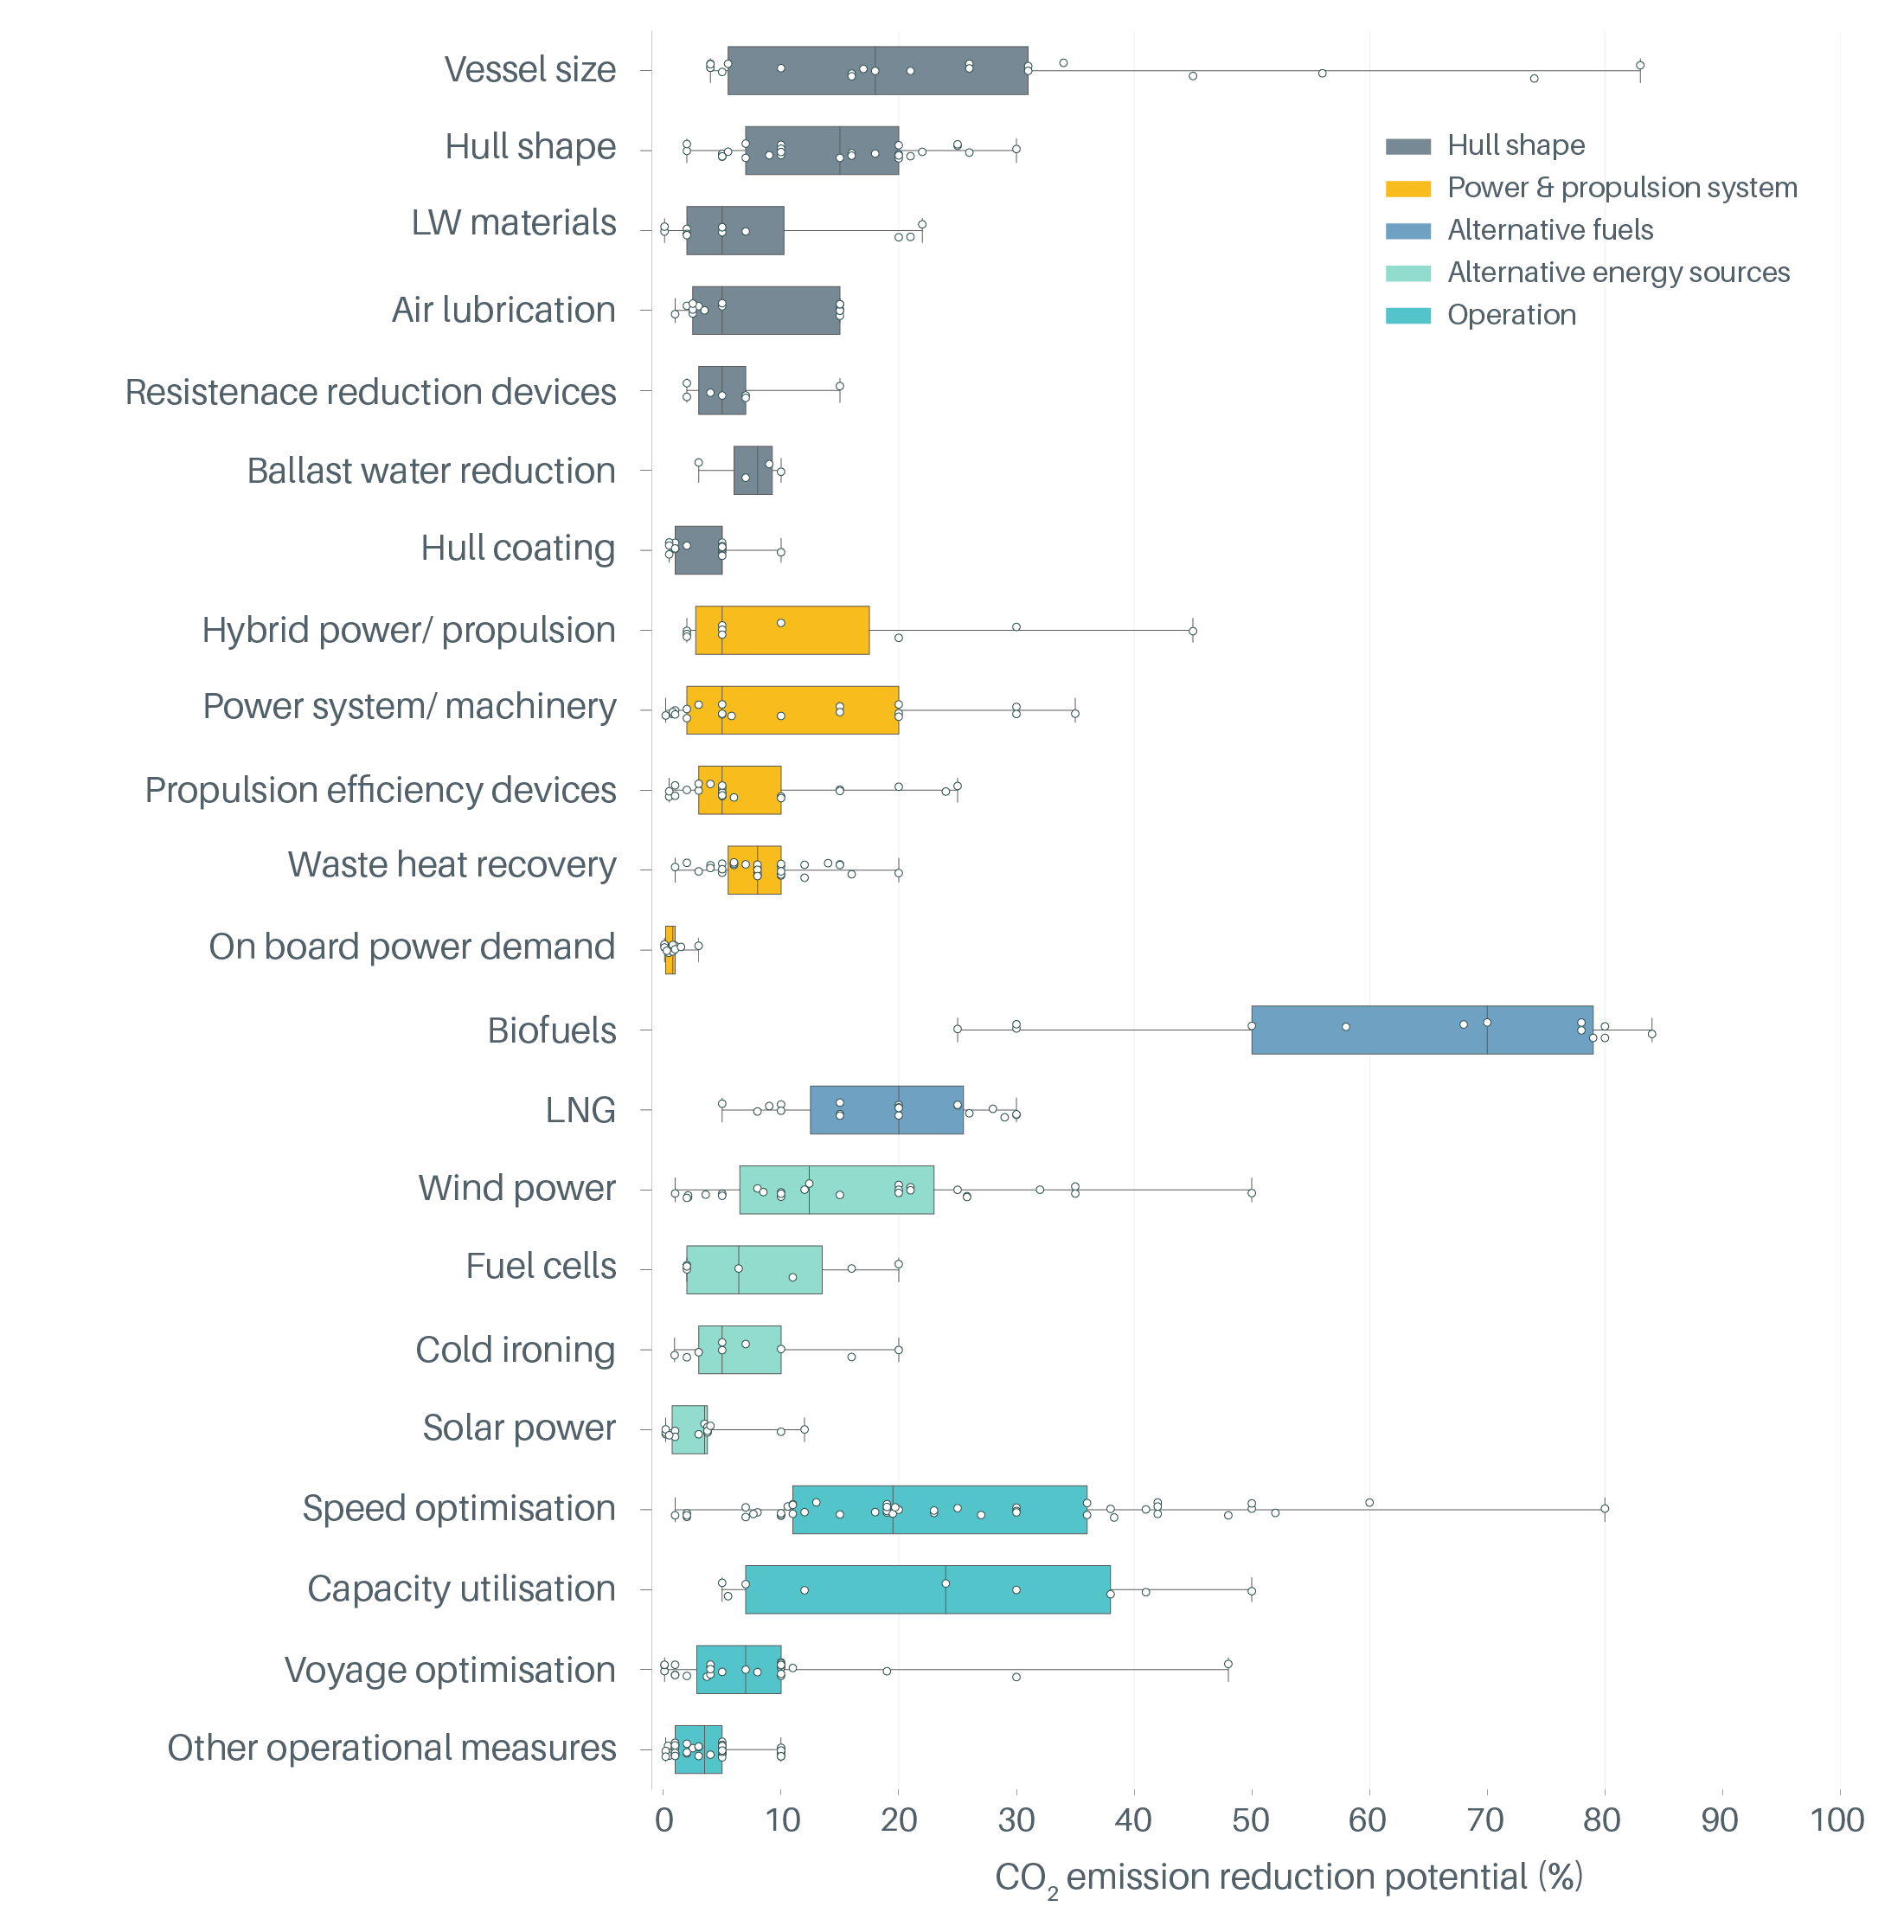
Alternative maritime fuels are increasingly attractive to countries and companies due to recent IMO regulations on conventional fuels, but the mitigation potential varies widely by fuel type.
Fiscal incentives in combination with enhanced regulations will play an important role in the uptake of sustainable maritime fuels.
Countries are making considerable investments into electrification of shipping vessels and ports to increase efficiency and reduce emissions and operational costs.
Shipping emissions could be reduced more than 75% by 2050 through a balanced combination of decarbonisation measures including sustainable biofuels, capacity utilisation and speed optimisation.
Figure 3.
Emission mitigation potential of major maritime transport measures
-
Impacts of the COVID-19 pandemic
International maritime trade dropped an estimated 4.1% in 2020, but trade volumes are expected to recover and grow 4.8% in 2021.
Global port container volumes fell 7.3% during 2020, and around 12% of the container fleet was assumed to be idle at the peak of initial pandemic lockdowns.
Growth in emissions from international shipping has been slowed by the pandemic and is not projected to return to pre-COVID-19 levels until 2030.
Figure 4.
Historic and projected emissions from international shipping, 2000-2050
Key indicators
2017*
2018*
% change
Key indicators
2017*
2018*
% change
Key indicators
2017*
2018*
% change
Key indicators
2017*
2018*
% change
Key indicators
2017*
2018*
% change
Key indicators
2017*
2018*
% change
Key indicators
2017*
2018*
% change
Key indicators
2017*
2018*
% change
Key indicators
2017*
2018*
% change
Key indicators
2017*
2018*
% change
Key indicators
2017*
2018*
% change
(*) Data are for the indicated year unless noted otherwise.

