Transport Emissions
Rising global demand for mobility and goods has had a direct impact on emissions in the transport sector. Between 2010 and 2019, transport emissions grew in most countries, with higher growth recorded in developing countries. Strong emission increases occurred in road transport, driven by growing use of larger vehicles. Emissions from passenger aviation rose significantly before diving sharply in 2020 due to the COVID-19 pandemic, and shipping emissions experienced even more dramatic declines.
Efforts to decarbonise passenger transport outpaced action in freight transport, although some progress occurred on the latter. The decoupling of transport CO2 emissions from GDP growth gained momentum – along with improvements in the energy intensity of transport – reflecting greater gains in developed countries. Reductions in black carbon yielded benefits for both transport emissions and local air quality. Although COVID-19 brought a temporary dip in transport emissions, this trend is projected to be short-lived.
Key Findings
-
Transport emission trends
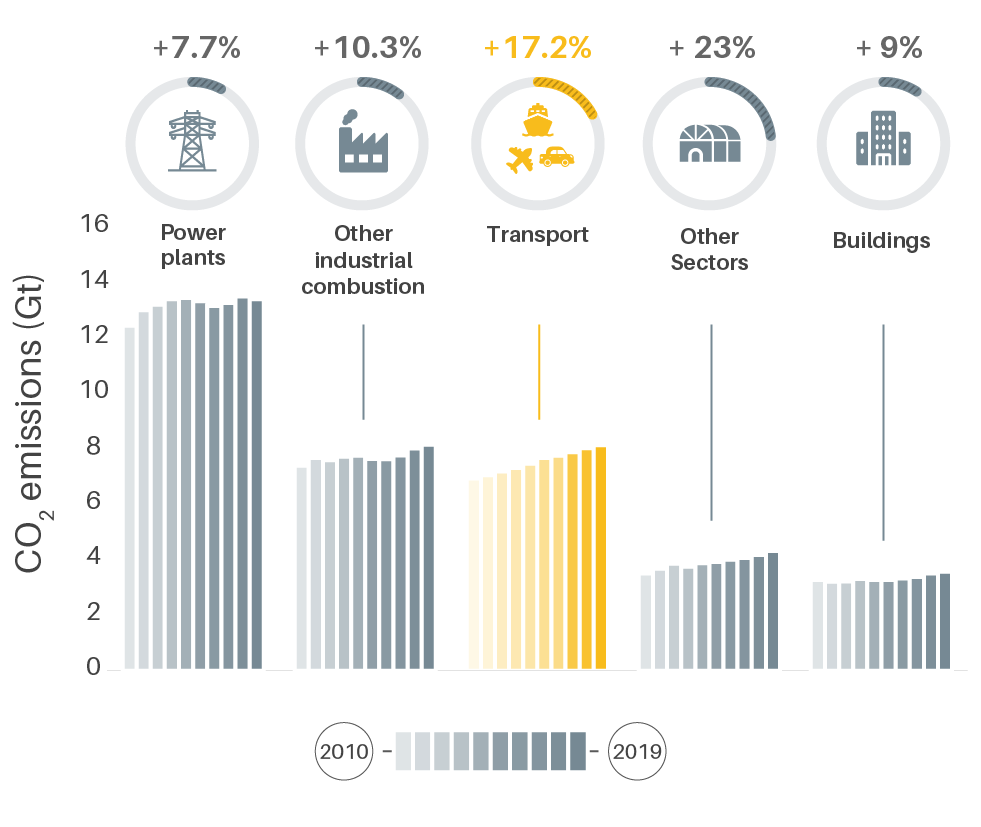
The transport sector was the fastest growing fossil fuel combustion sector worldwide from 2010 to 2019, with sectoral emissions rising 17.2% during this period. In absolute terms, transport (alongside “other industrial combustion”) was the second highest emitting sector in 2019.
Figure 1.
Global CO2 emissions by sector, 2010-2019
Global transport emissions increased 1% in 2019, well below the 2% annual average growth rate for the decade.
Between 2010 and 2019, transport carbon dioxide (CO2) emissions grew 4% in member countries of the Organisation for Economic Co-operation and Development (OECD) and 34% in non-OECD countries.
In 2019, transport CO2 emissions fell more than 10% in some countries, but grew more than 5% in many countries, with growth exceeding 10% in some cases.
Figure 2.
Annual growth in transport CO2 emissions, 2018-2019
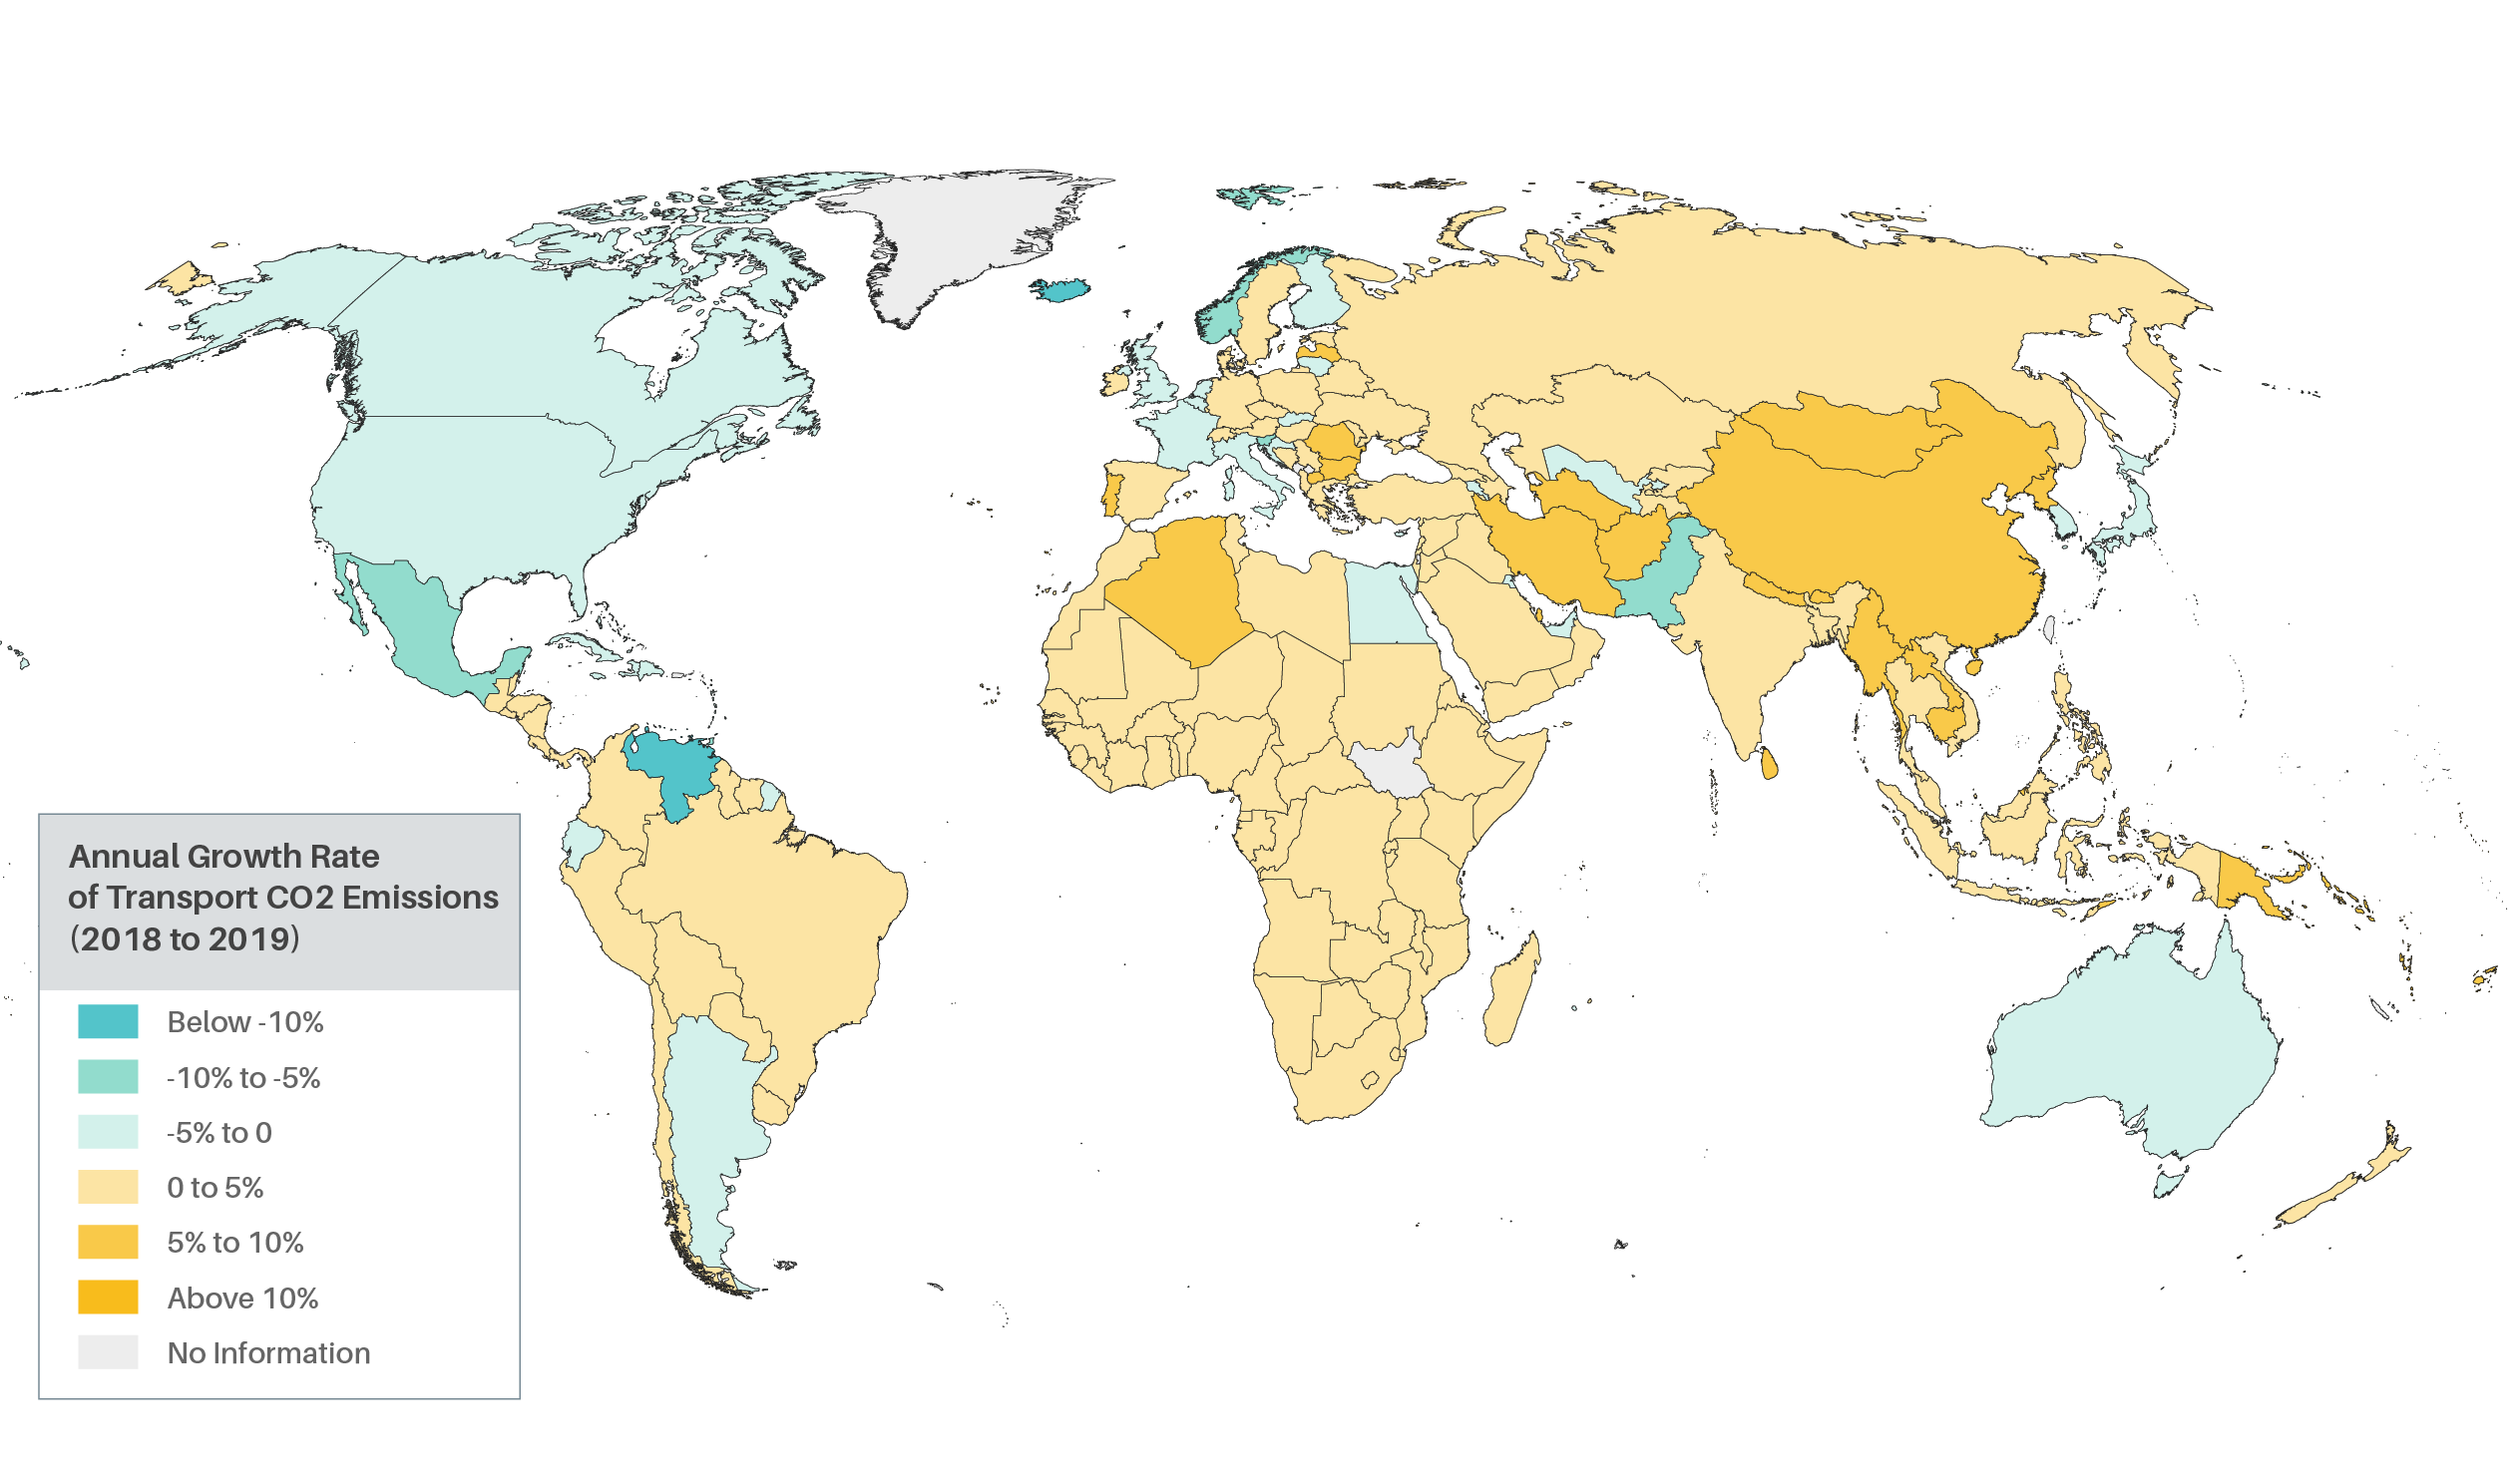
Globally, most countries experienced 1% to 5% growth in their transport emissions that year
-
Transport emissions by mode and sub-sector
In 2018, CO2 emissions grew for all major transport modes and sub-sectors, except railways.
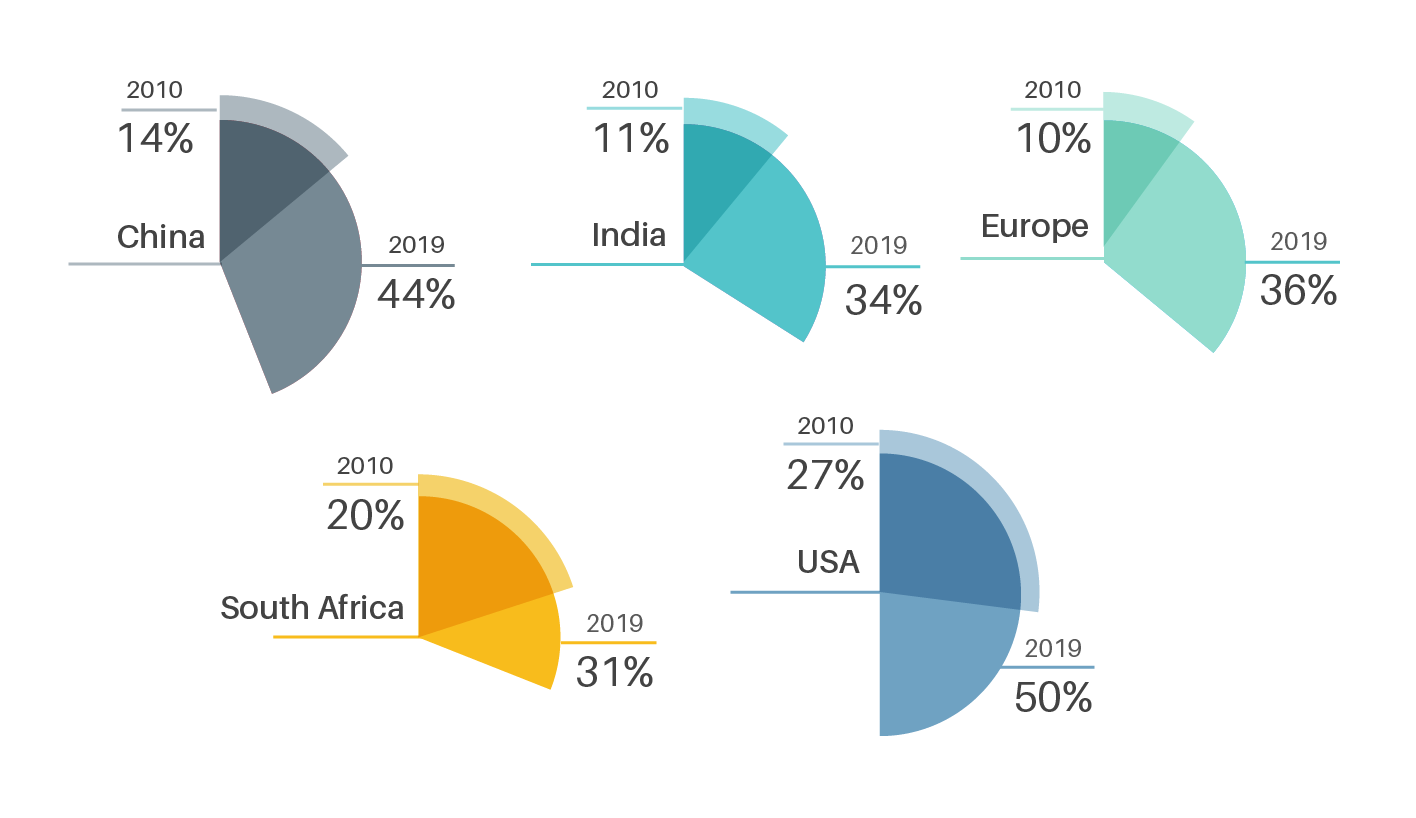
Larger passenger vehicles – specifically sport utility vehicles (SUVs, including pickup trucks) – were the biggest driver of passenger transport emissions between 2010 and 2018, contributing 533 million tonnes of CO2 during this period.
Figure 3.
Share of SUVs in annual passenger car sales in selected countries and regions, 2010 and 2019
Emissions from motorised two-wheelers accelerated; however, vehicle-level CO2 emissions for two-wheelers are relatively low compared to larger vehicles.
Ride-hailing services have increased rather than decreased CO2 emissions in many regions and cities, resulting in an estimated 69% increase in climate pollution compared to the trips they displace, in part by increasing traffic congestion.
Aviation emissions increased 32% between 2013 and 2018, exceeding projections for this period.
Although freight transport accounted for only 5% of the vehicle fleet in 2017, it contributed 42% of total transport CO2 emissions as well as disproportionately high levels of local air pollutants.
Decarbonisation efforts have been slower for freight transport than for passenger transport, although some national and sub-national governments have increased funding commitments.
As nearly zero emission modes of transport, walking and cycling contribute to Paris Agreement targets for reducing transport-related emissions, while moving 6-8 times more people per hour in the same space compared to higher-carbon, motorised personal vehicles.
-
 Transport emissions and GDP growth
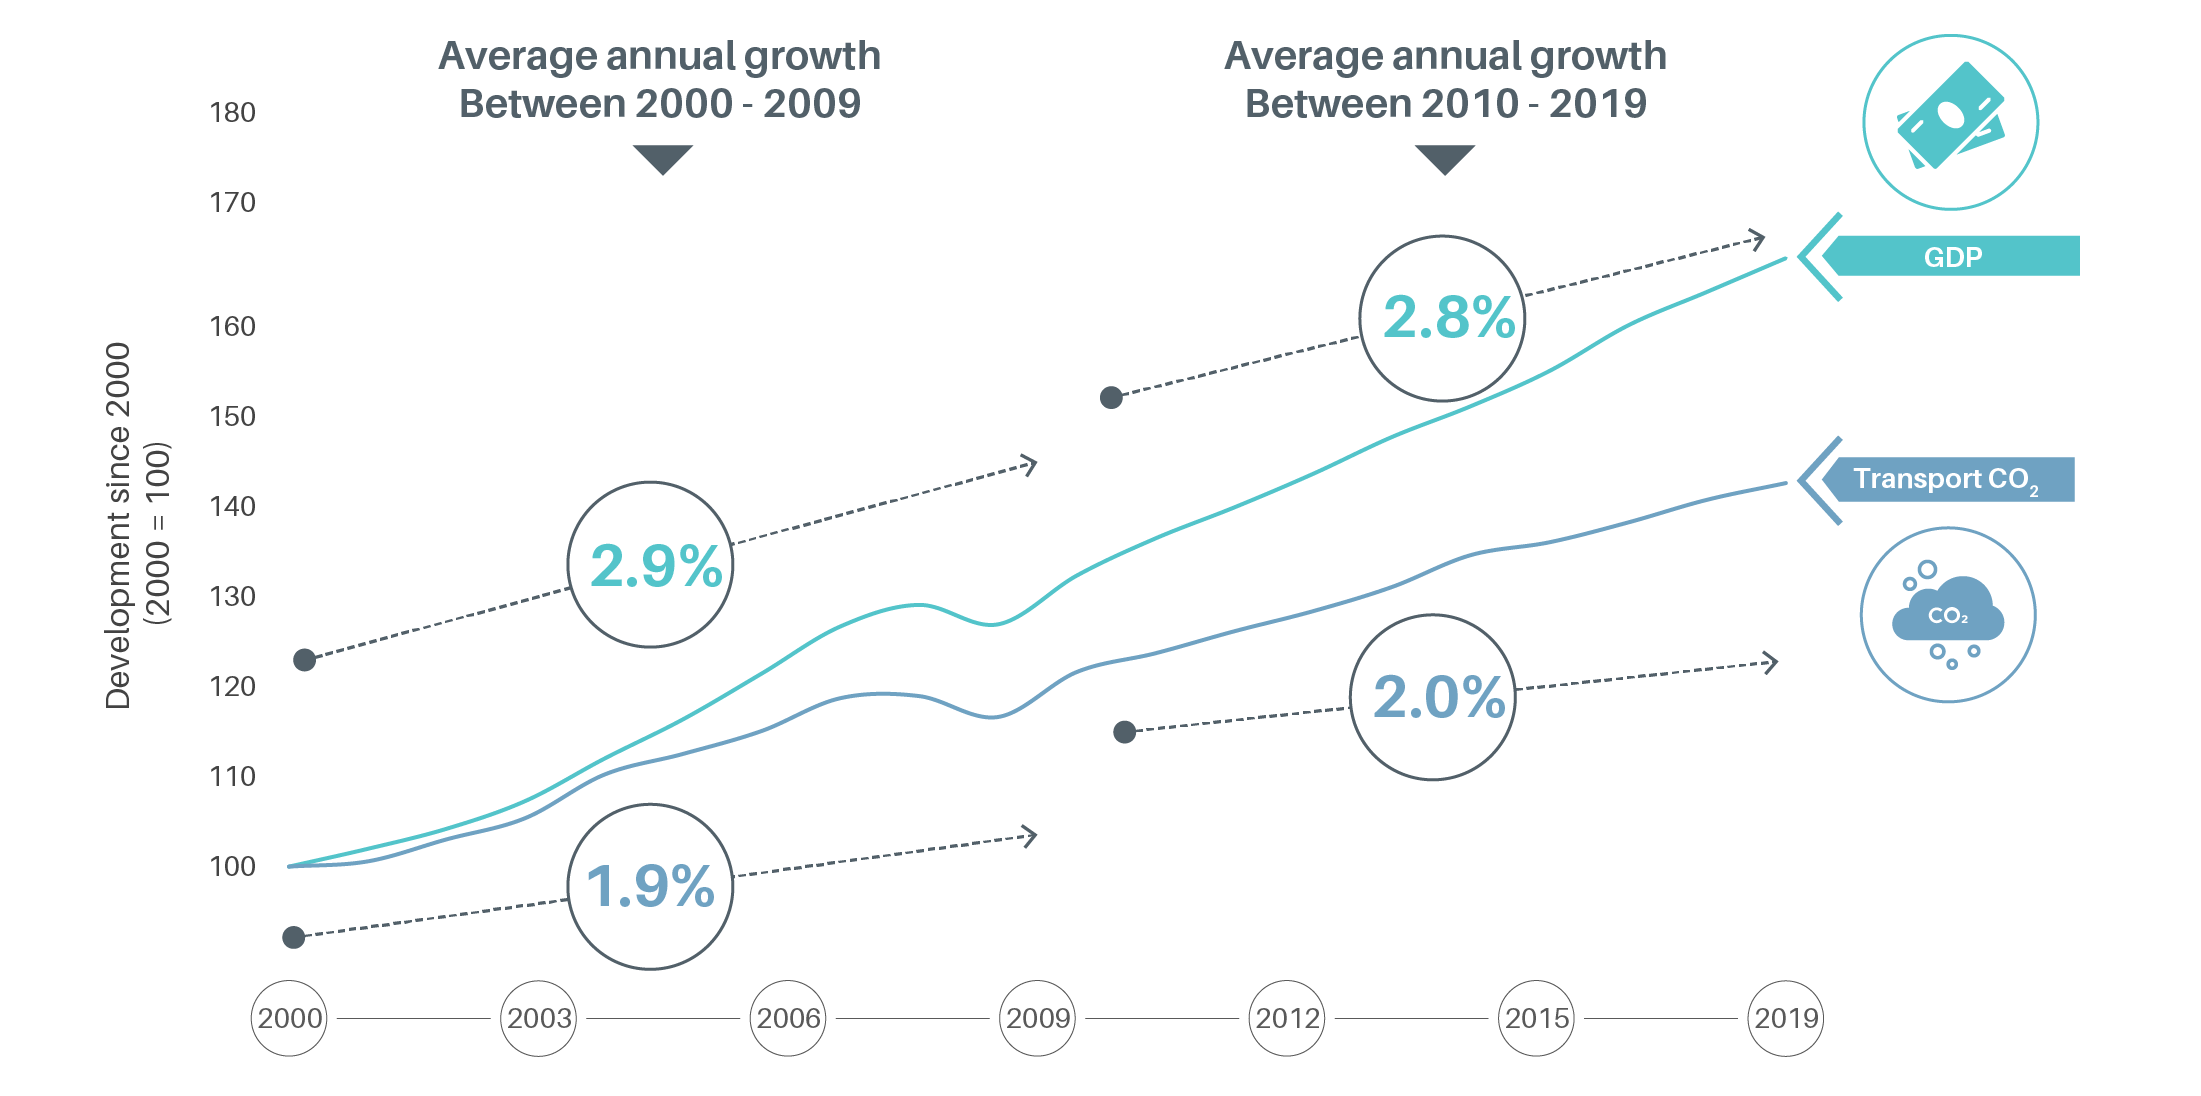
Global gross domestic product (GDP) grew 2.9% annually on average between 2000 and 2019, while annual transport CO2 emissions grew at a slower rate of 1.9% during 2000-2010 and 2.0% during 2010-2019; however, additional structural changes are needed to completely decouple economic growth and transport emissions.
Figure 5.
Decoupling of transport CO2 emissions and GDP, 2000-2019
Since 2000, a strong decoupling of GDP and transport CO2 emissions has been observed in OECD countries, with divergence beginning during the 2007 global financial crisis.
Figure 6.
GDP and transport CO2 emissions in OECD and non-OECD countries, 2000-2018
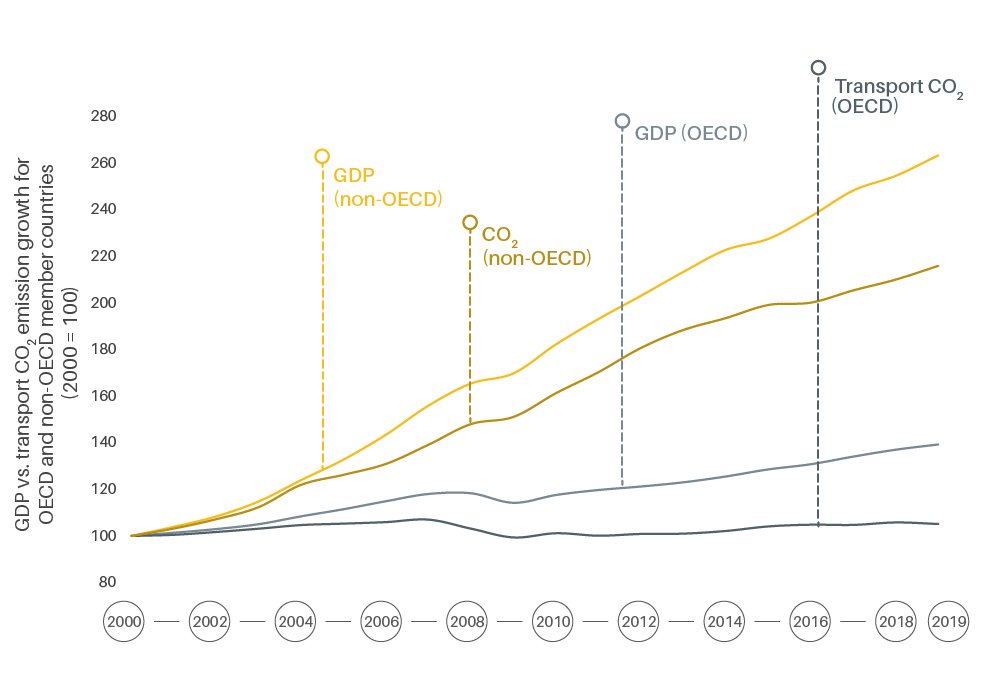
Non-OECD countries have also experienced a decoupling of transport emissions and GDP growth, although at a lower intensity and a less rapid pace.
-
 Transport energy intensity
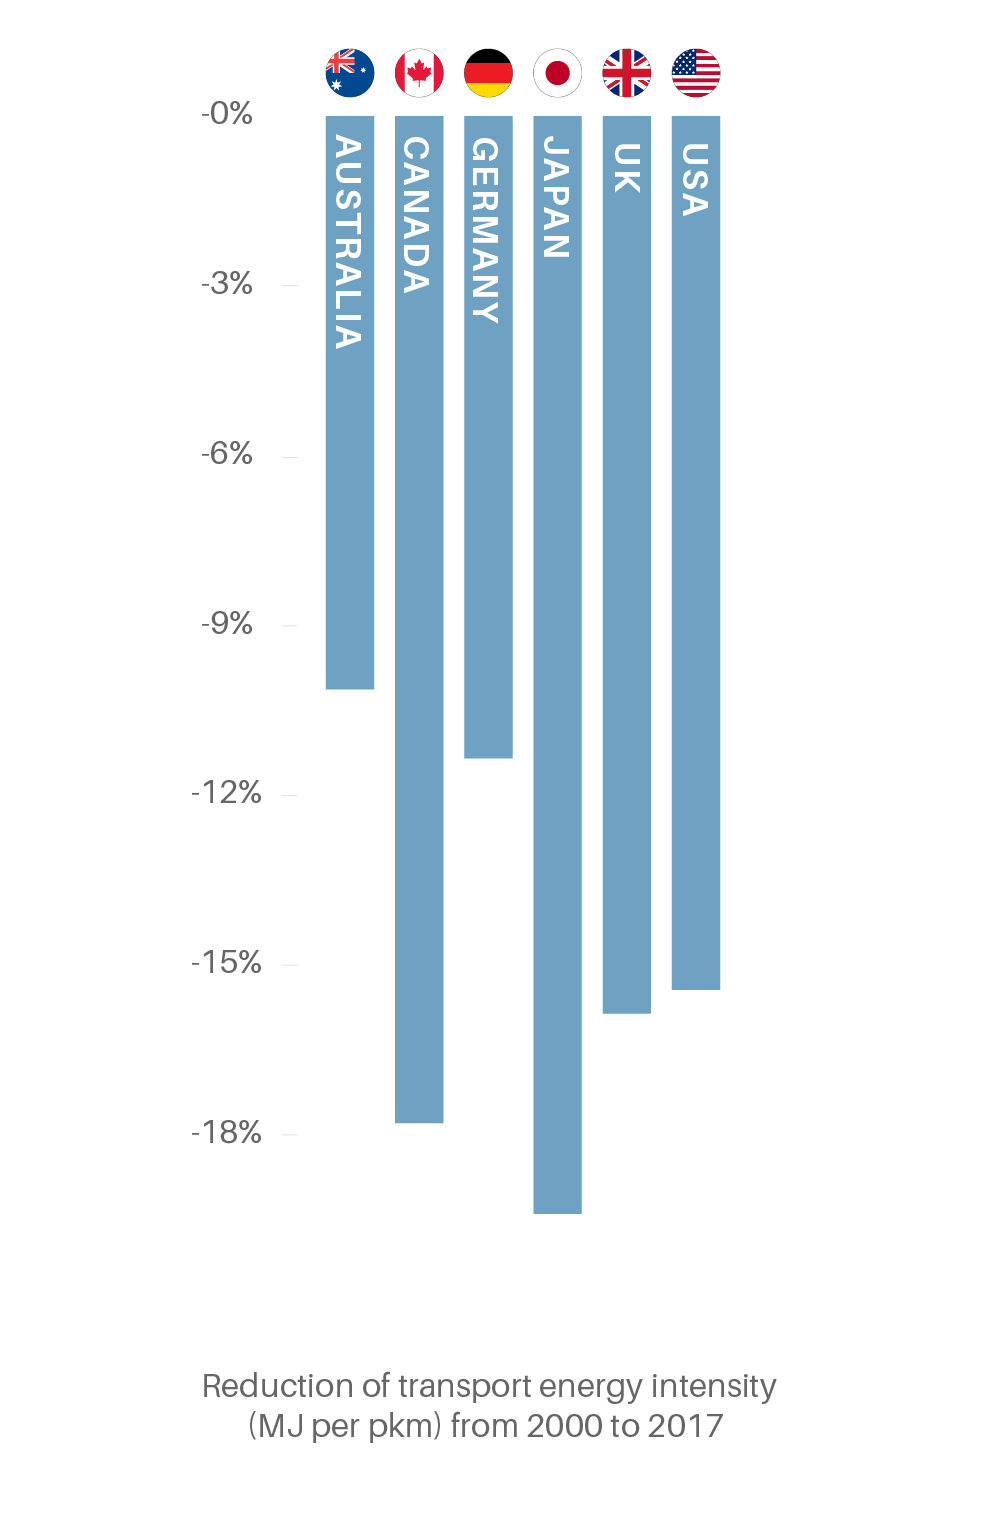
The energy intensity (total energy consumption per unit of GDP) of the transport sector continued to improve in 2018, decreasing 2.1% from the previous year, far faster than the 1.5% average annual decline for 2000-2017.
Figure 7.
Transport energy intensity by region and country, 2010-2019
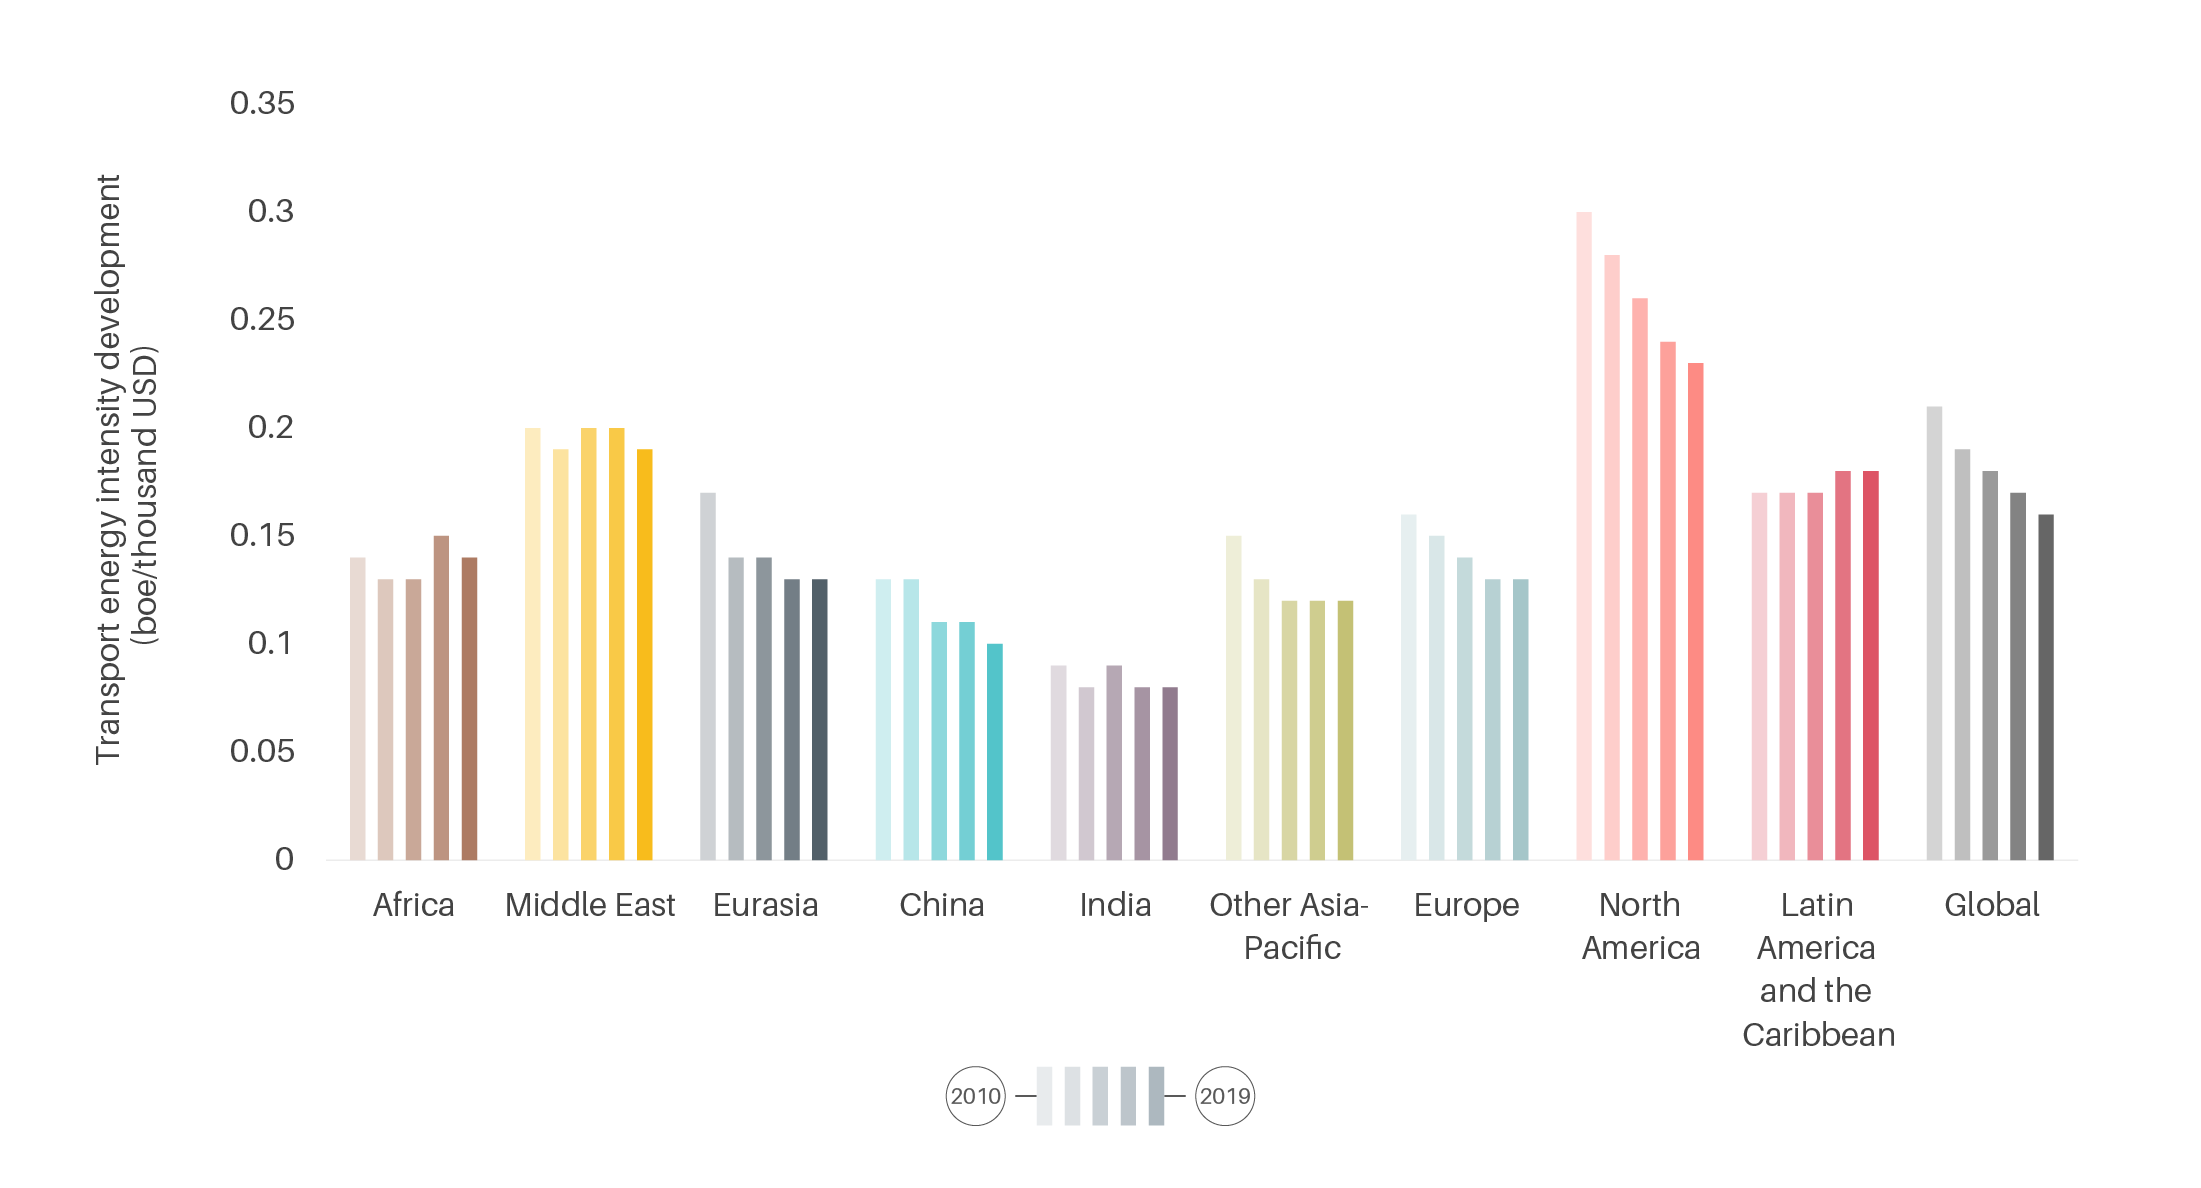
Figure 8.
Improvement of transport energy intensity in selected countries, 2000-2017
The transport sector is 97% fossil fuel-powered and is the least diversified of all energy end-use sectors, remaining far from being fuelled primarily by renewable sources.
As more electric vehicles enter the vehicle fleet, the carbon intensity of passenger transport has improved slightly.
The carbon intensity of the shipping sector (CO2 per deadweight tonne-nautical mile) improved 30% during the period from 2008 to 2018 – faster than the sector’s stated target of 40% by 2030 – due to an increase in the average ship size.
Between 2010 and 2018, the average carbon intensity of electricity generated globally improved 10%. As the market for electrified transport expands, it can leverage these cleaner grids to reduce overall transport emissions.
-
 Other climate-related transport impacts
As of June 2019, some 39 countries had adopted “soot-free” standards for heavier vehicles, helping to reduce black carbon emissions.
A decoupling of economic growth and black carbon emissions for heavy-duty vehicles is under way, and accelerating this shift would result in an estimated USD 1 trillion in societal savings.
-
Impacts of the COVID-19 pandemic
In 2020, global transport CO2 emissions dropped 19.4% below 2019 levels due to the pandemic, the biggest decrease of any sector; however, this decline is projected to be short-lived.
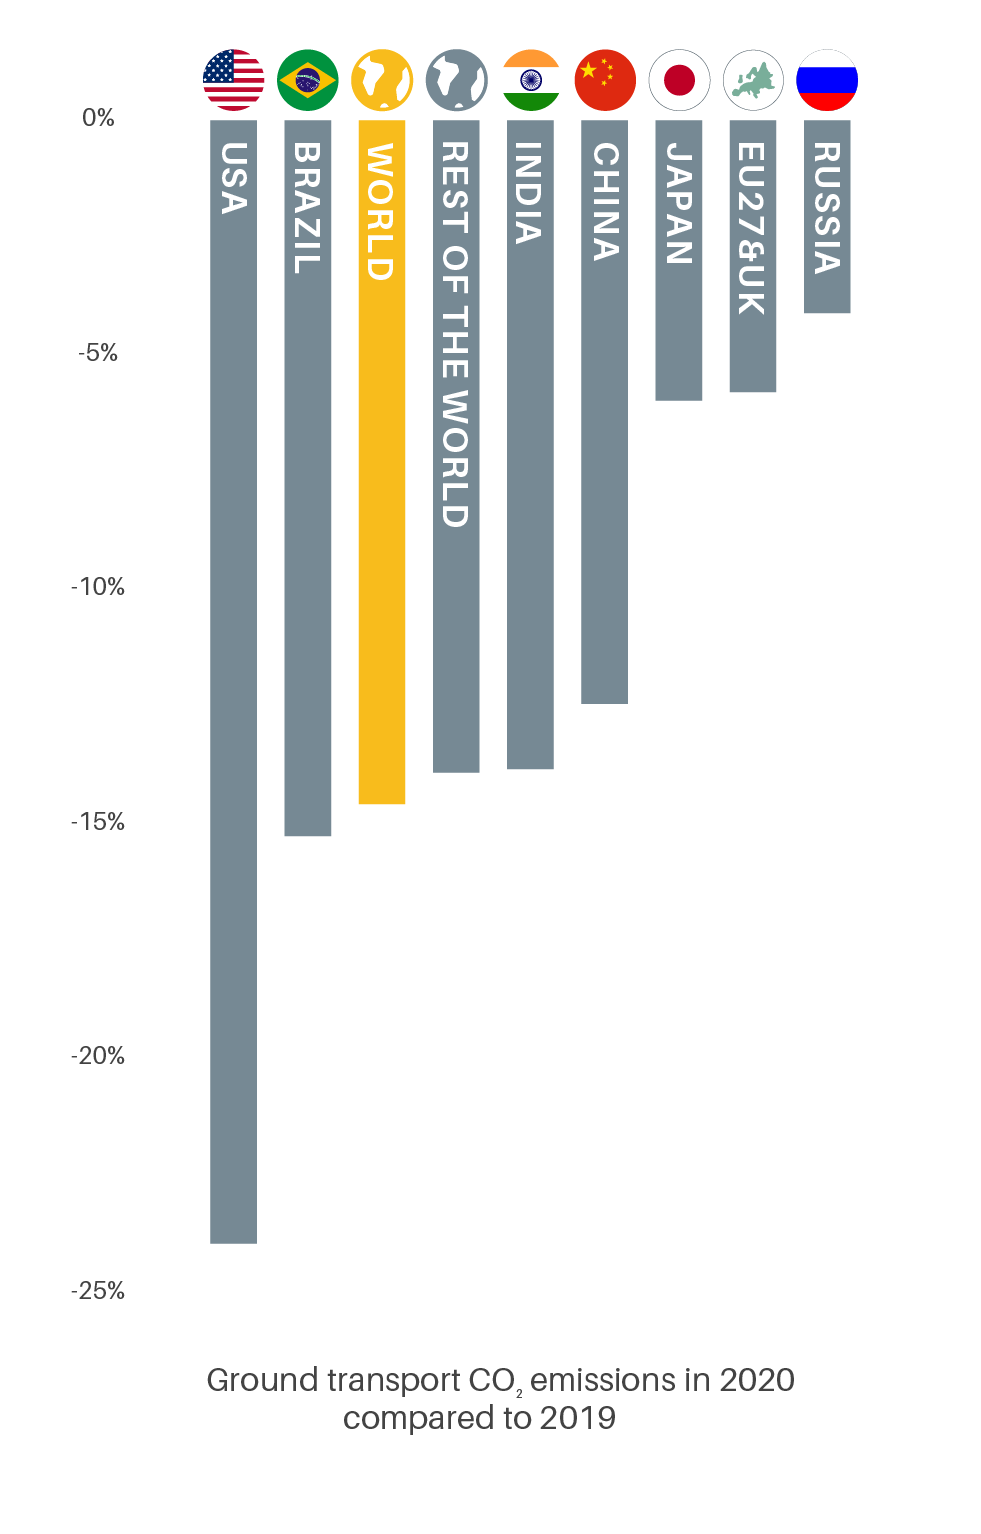
The US saw the strongest decline in ground transport CO2 emissions in 2020, down 24% from 2019 levels, followed by Brazil (down 15.3%).
Figure 9.
CO2 emissions from ground transport, by country, 2020
The impact of the COVID-19 pandemic on both GDP and transport CO2 emissions may result in an equal or stronger decoupling of economic growth and emissions than seen in recent years.

