Low-Carbon Transport Pathways
The transport sector’s share of energy-related greenhouse gas emissions is on a trajectory to grow in both absolute and percentage terms. Overall, the Intergovernmental Panel on Climate Change has identified transport as one of the most difficult sectors to fully decarbonise. The COVID-19 pandemic is perceived to have effects on the future pathways of transport CO2 emissions, but the long-term impact will likely depend on the recovery measures implemented.
The International Energy Agency (IEA) projects in its sustainable development scenario that transport will be the second highest emitter of CO2 in the energy end-use sector (after industry) by 2032, and the highest emitter in 2070, due to lingering fossil fuel use in aviation, road freight and maritime shipping. Similar results from the International Renewable Energy Agency project that the transport sector’s share of global emissions will equal that of industry by 2030, and then overtake industry to become the largest emitter of CO2 in end-use sectors in the period from 2030-2040.
Key Findings
-
 2020 emission reduction targets
While the majority of Annex I countries (industrialised countries and economies in transition) under the Kyoto Protocol have met their 2020 targets for reducing greenhouse gas emissions, the world is not on track to meet the overall Paris Agreement target for 2030.
Transport is the only sector where emission levels rose in Annex I countries between 1990 and 2020, increasing 19%.
Figure 1.
CO2 emissions in Annex I countries by sector, 1990-2020
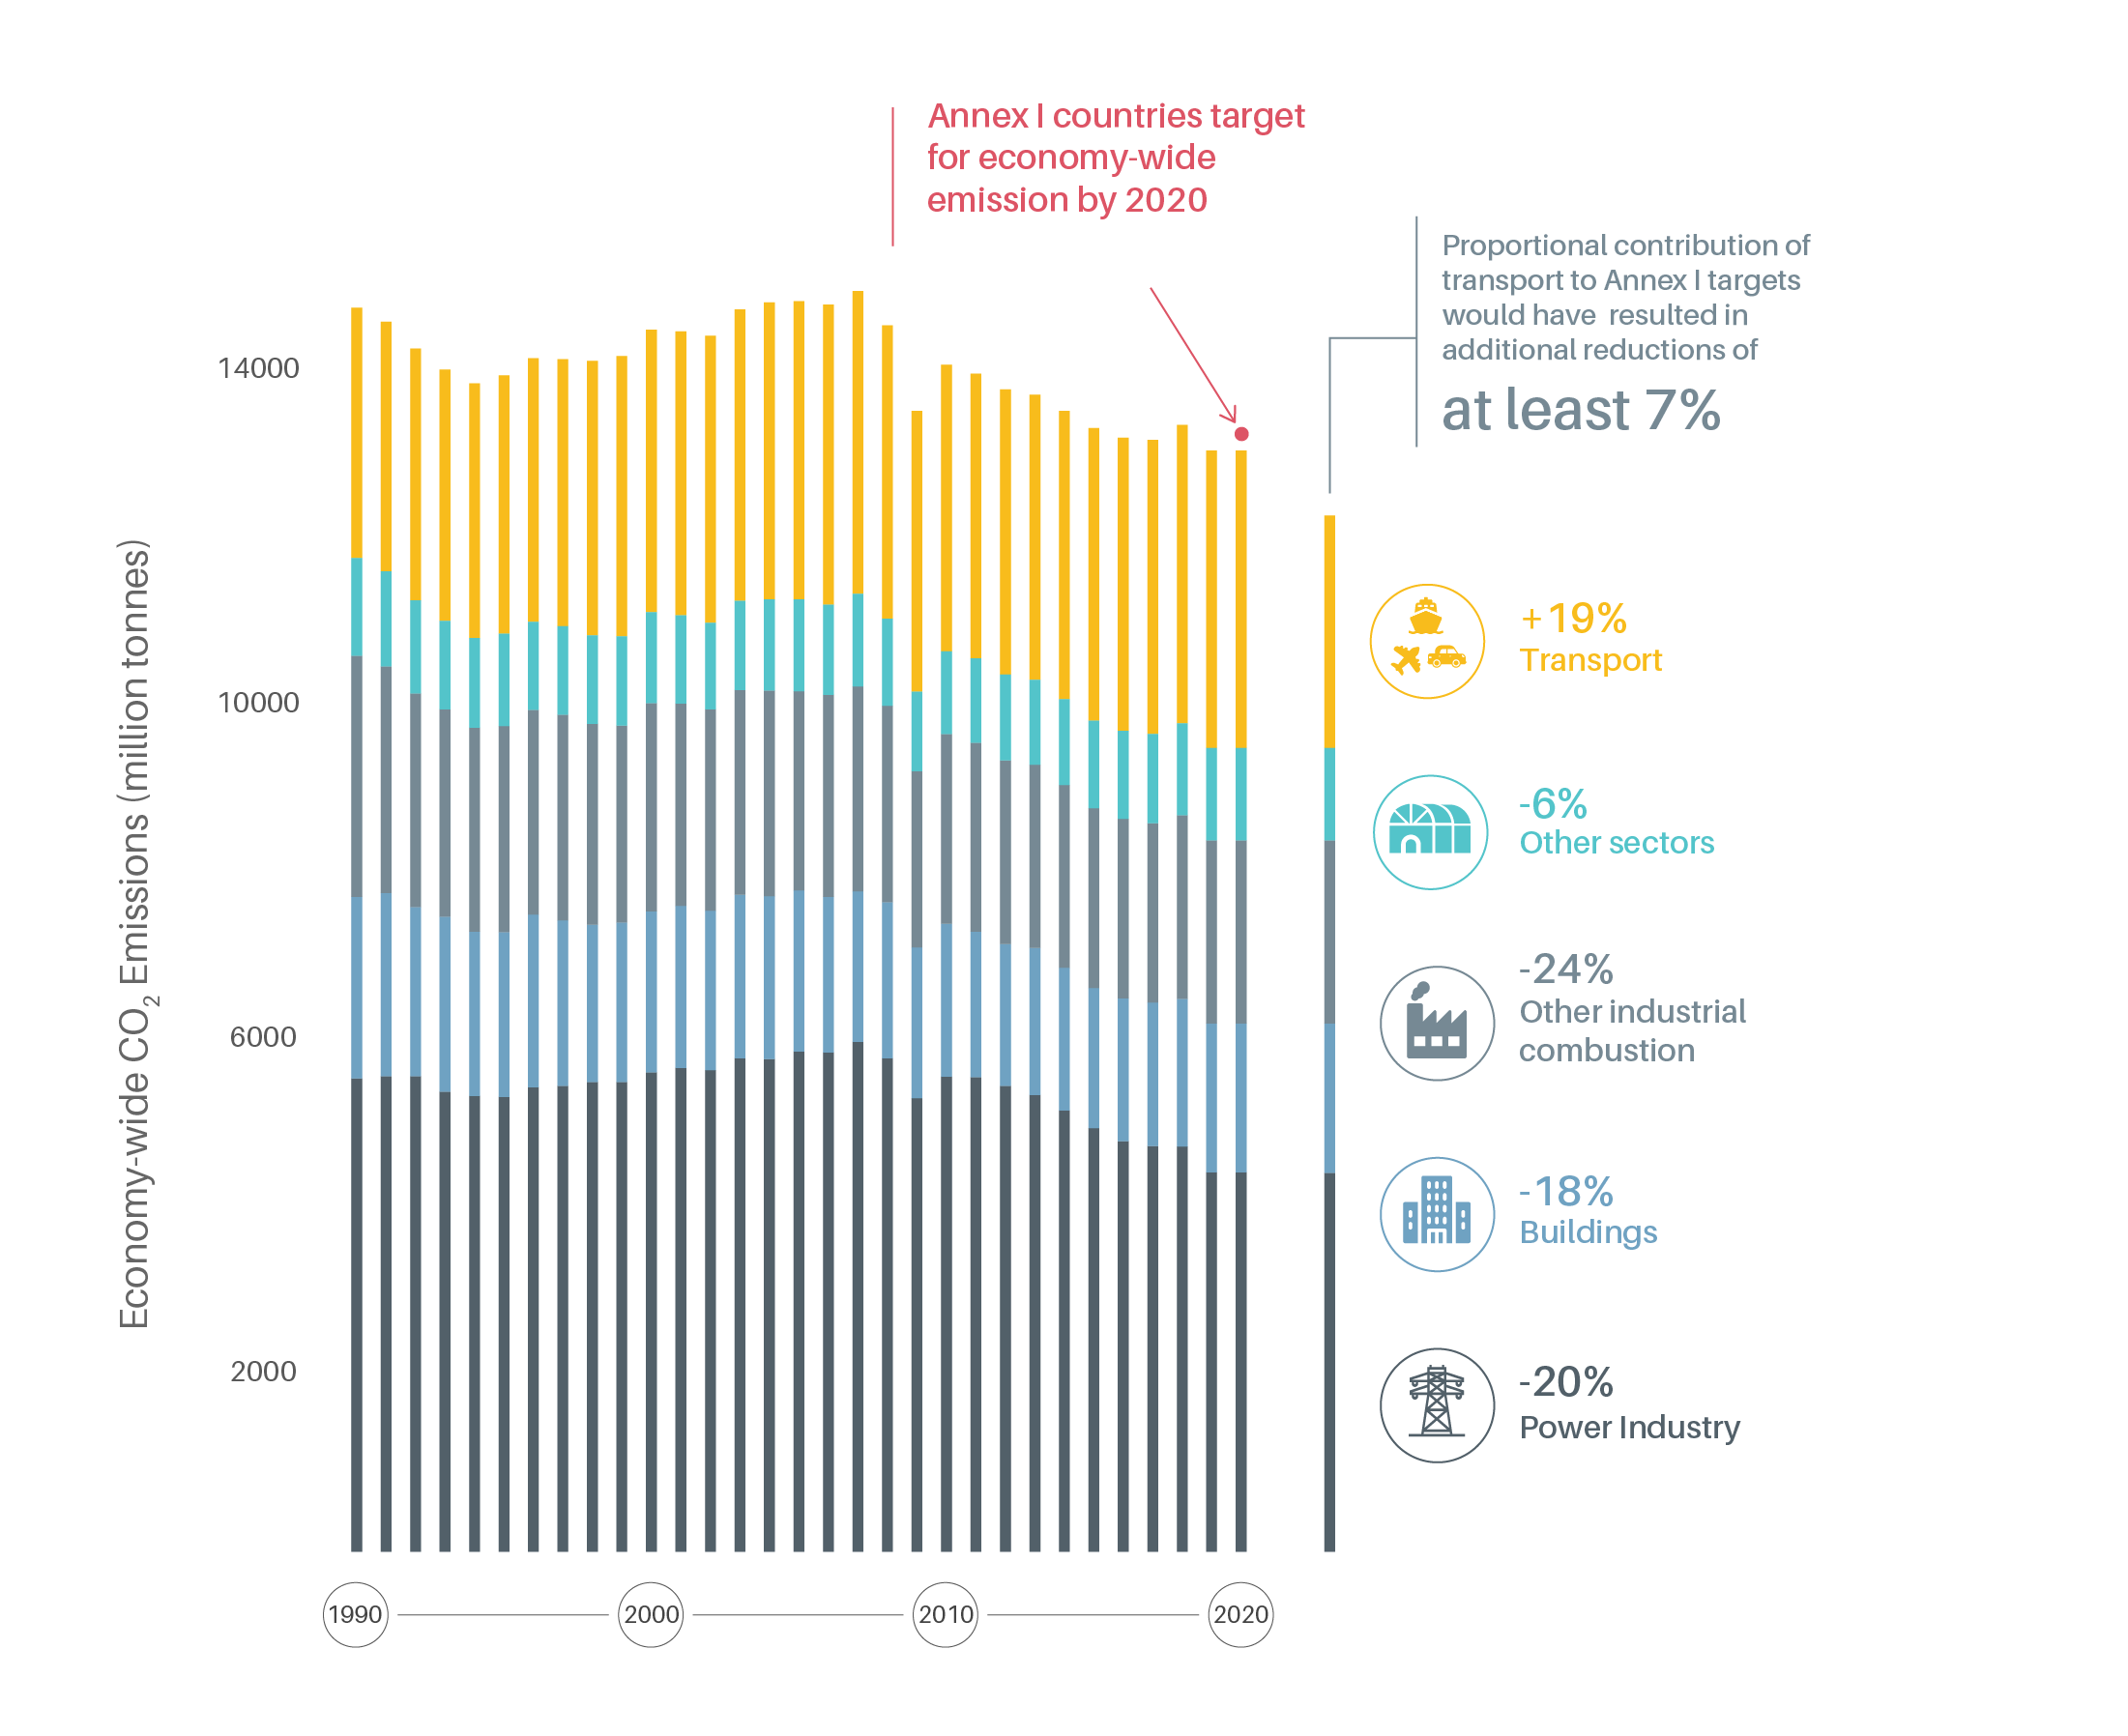
Had the transport sector contributed proportionally to the agreed 2020 targets of the Kyoto Protocol 2020, transport CO2 emissions would have been reduced by at least an additional 7%.
Vehicle electrification and transport renewable energy targets for 2020 set in early 2010 have largely not been met.
-
 2050 transport emission pathways
To keep the rise in global temperature below 2 degrees Celsius (°C), annual transport emissions must be reduced to 5 gigatonnes of CO2 or less by 2050; and to keep the rise below 1.5 °C, emissions must be reduced to roughly 2-3 gigatonnes of CO2. This would mean slashing per capita transport CO2 emissions from 0.88 tonnes in 2019 to 0.2 tonnes in 2050.
Figure 2.
Transport emission pathways for the business-as-usual, 2 °C and 1.5 °C scenarios, 2018-2050
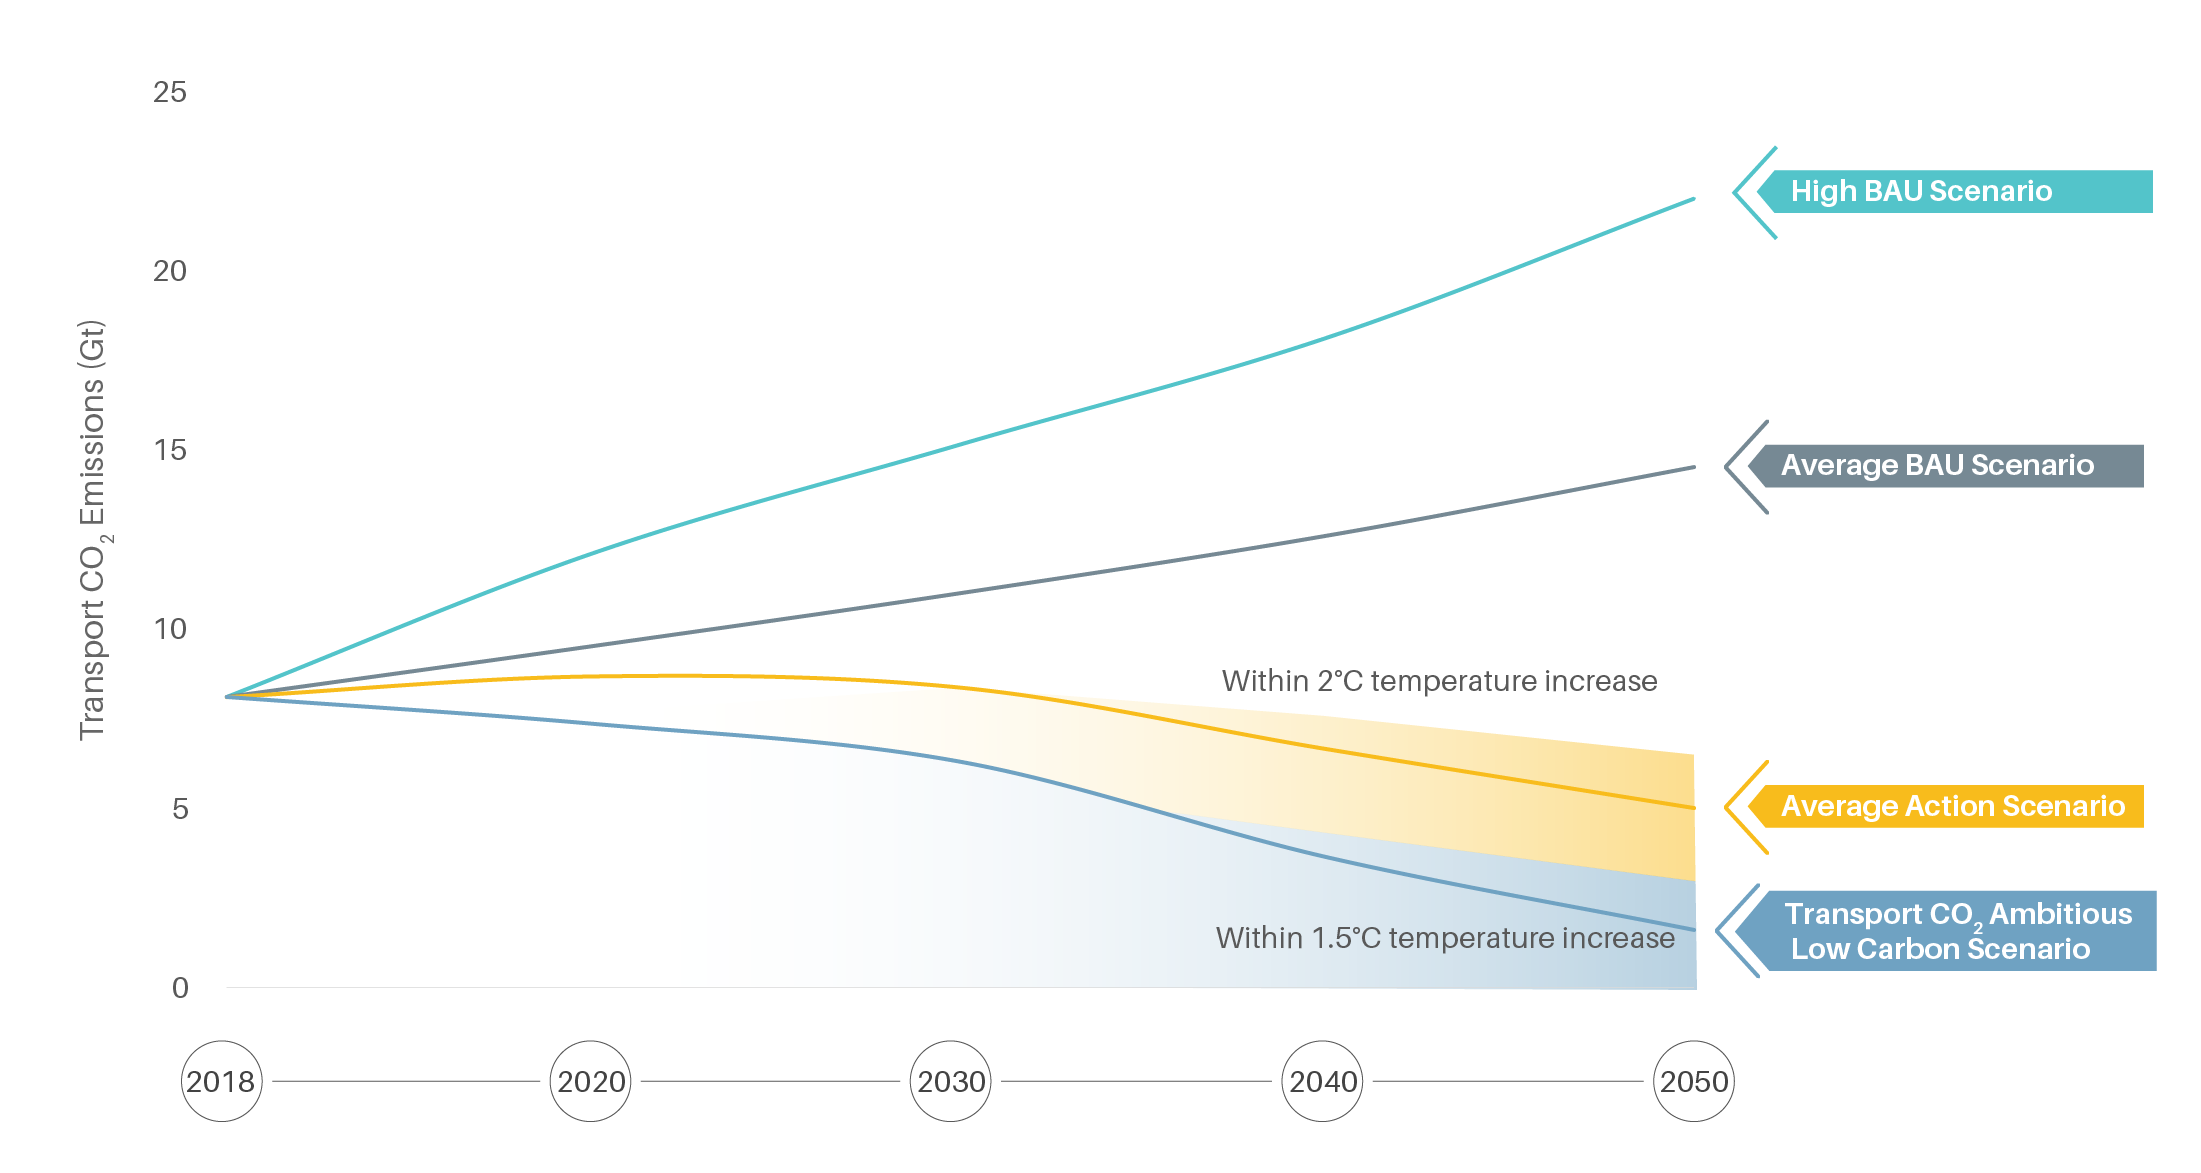
To achieve the 1.5 °C scenario with ambitious low carbon transport measures, emissions must start to decline now. To achieve a 2 °C scenario, the mitigation can be delayed until 2030, but emissions must plateau at around 2020 levels.
Studies indicate that high-income countries were nearing their peak in transport CO2 emissions by 2020.
The majority of projected growth in transport emissions is in road transport (both passenger and freight) in middle-income countries, as well as in international aviation and shipping.
Despite progress in reducing the energy intensity of transport, the sector is expected to have the highest carbon intensity among all sectors in 2040 due to its high dependency on fossil fuels.
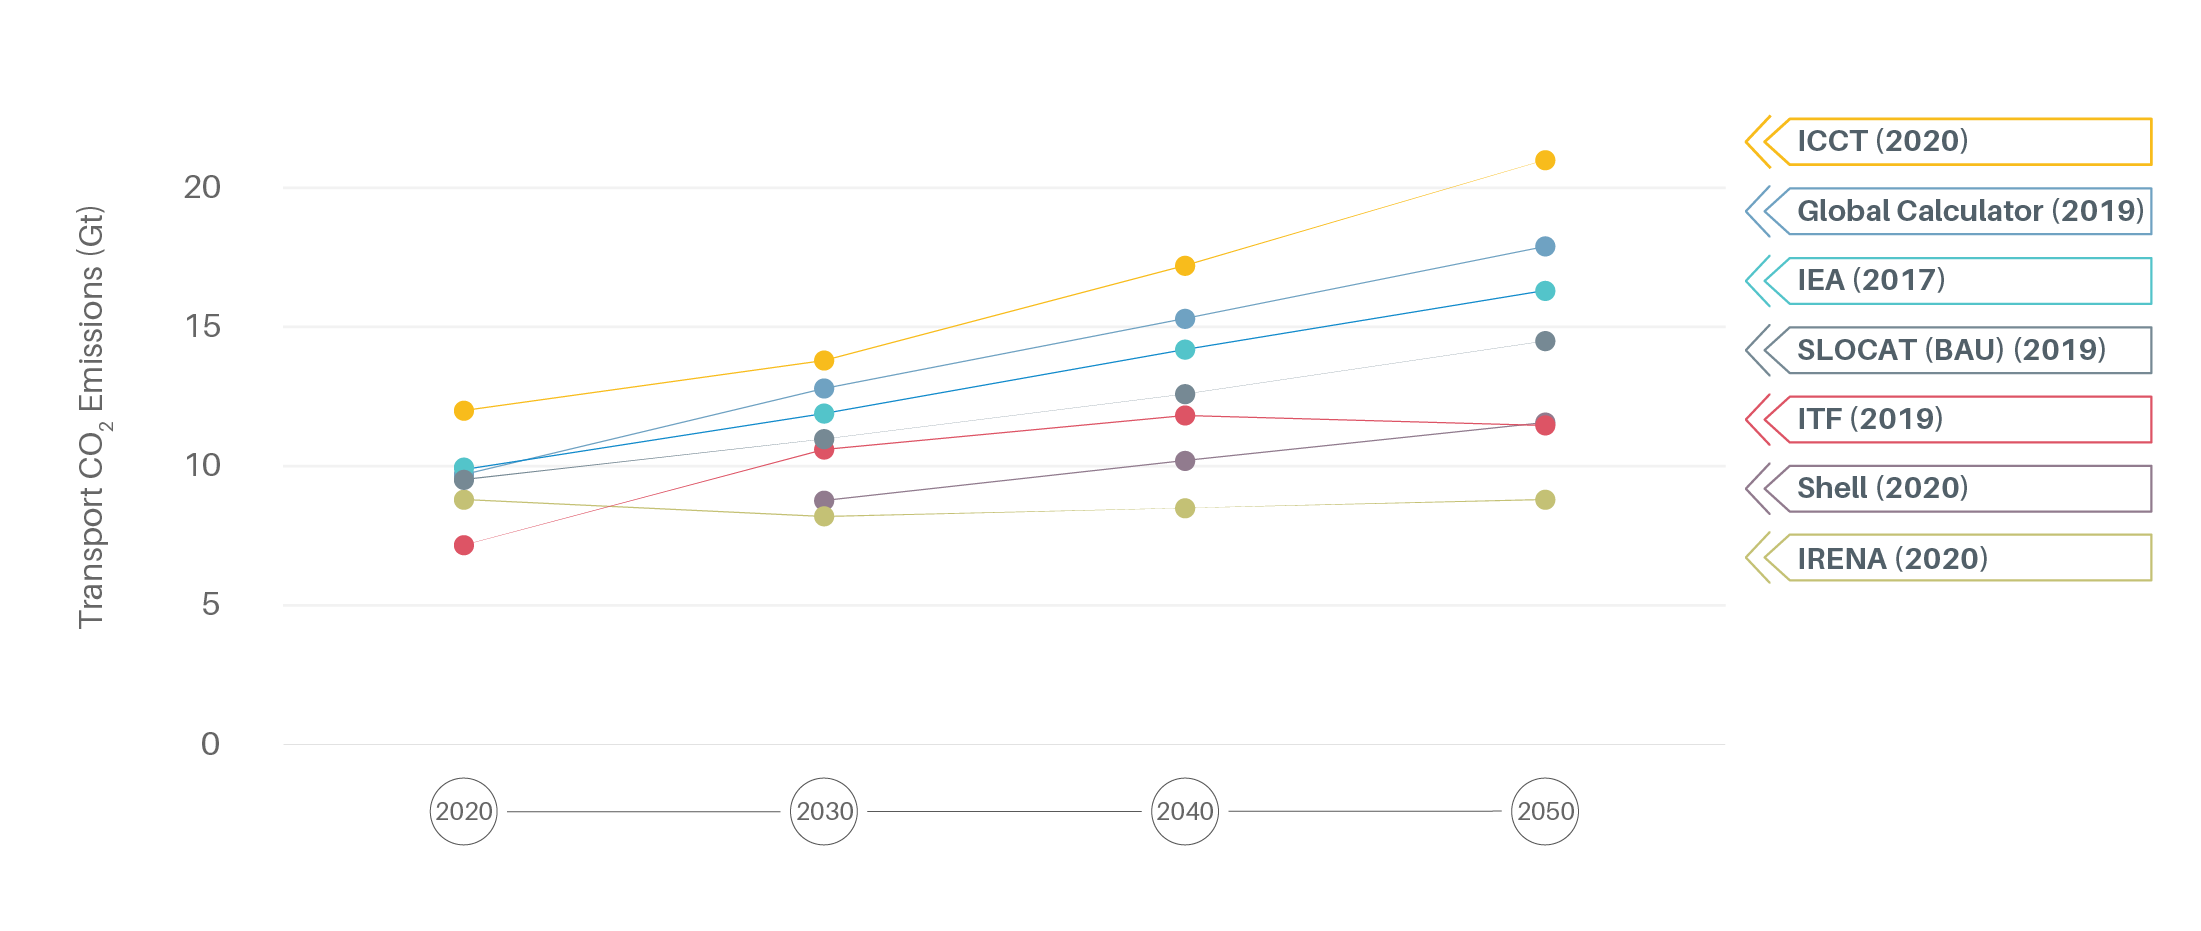
An analysis of transport emission pathways based on national studies shows that despite recent efficiency gains, the sector is not on track to meet 2050 emission reduction targets. In the most recent (2019) analysis, under the average business-as-usual pathway, global transport CO2 emissions could increase from 8 gigatonnes in 2019 to 14.5 gigatonnes in 2050.
Figure 3.
Comparison of business-as-usual projections for transport emissions, 2017 and 2019 studies
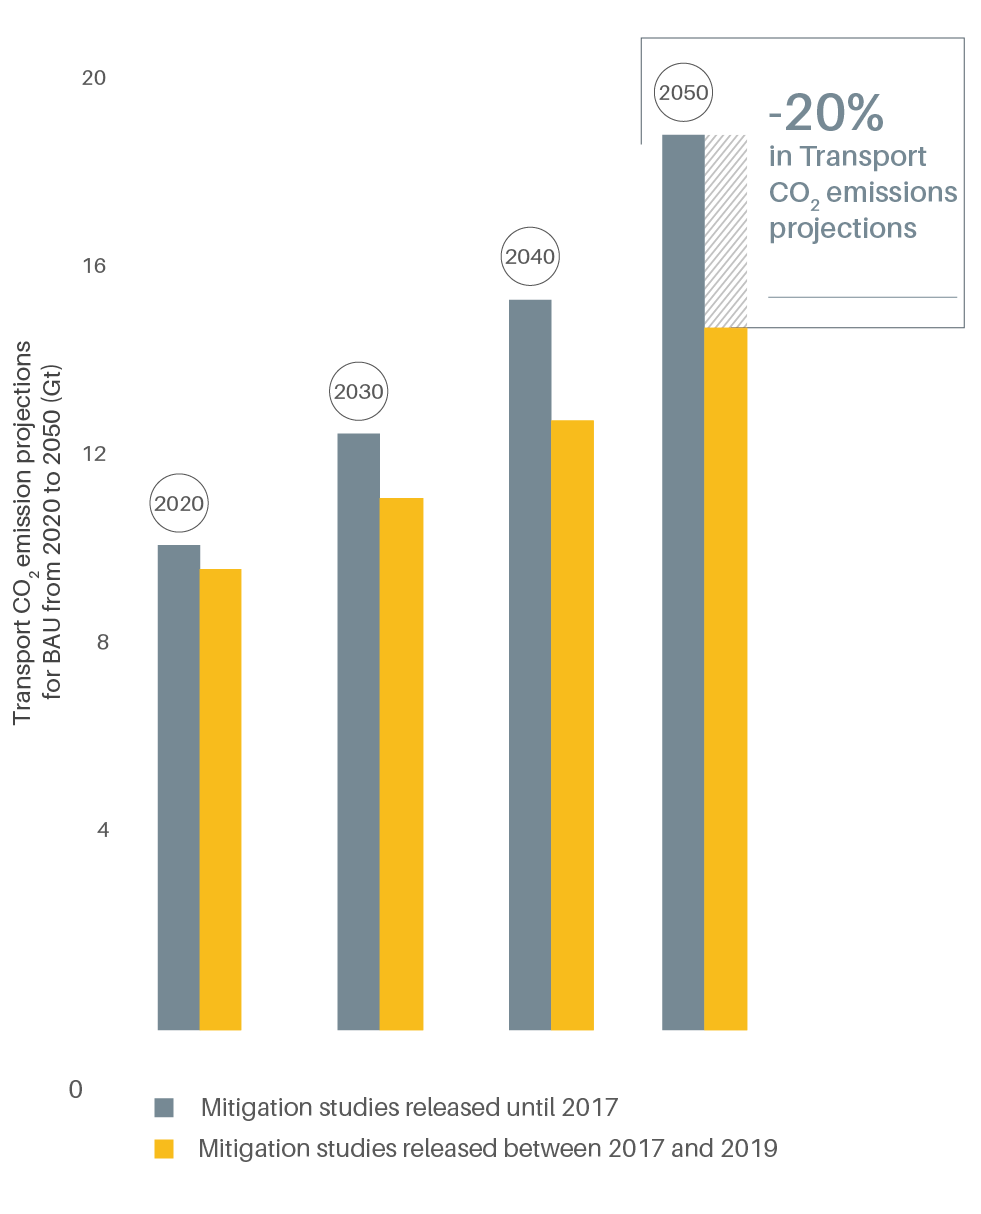
Low carbon transport measures are becoming increasingly efficient and lead to a more positive trend than previously projected. Whereas previously (in 2017) the emission gap was estimated to reach 16 gigatonnes of CO2 by 2050, new estimates (based on studies up to 2019) show a gap of around 12 gigatonnes.
Figure 4.
Projections for business-as-usual transport CO2 emissions, 2020-2050
A balanced and inter-modal application of Avoid, Shift and Improve measures is capable of yielding an estimated reduction in transport emissions of 2.39 gigatonnes of CO2-equivalent by 2030 and 5.74 gigatonnes of CO2-equivalent by 2050.
Figure 5.
Emission reductions resulting from various transport measures, 2030 and 2050
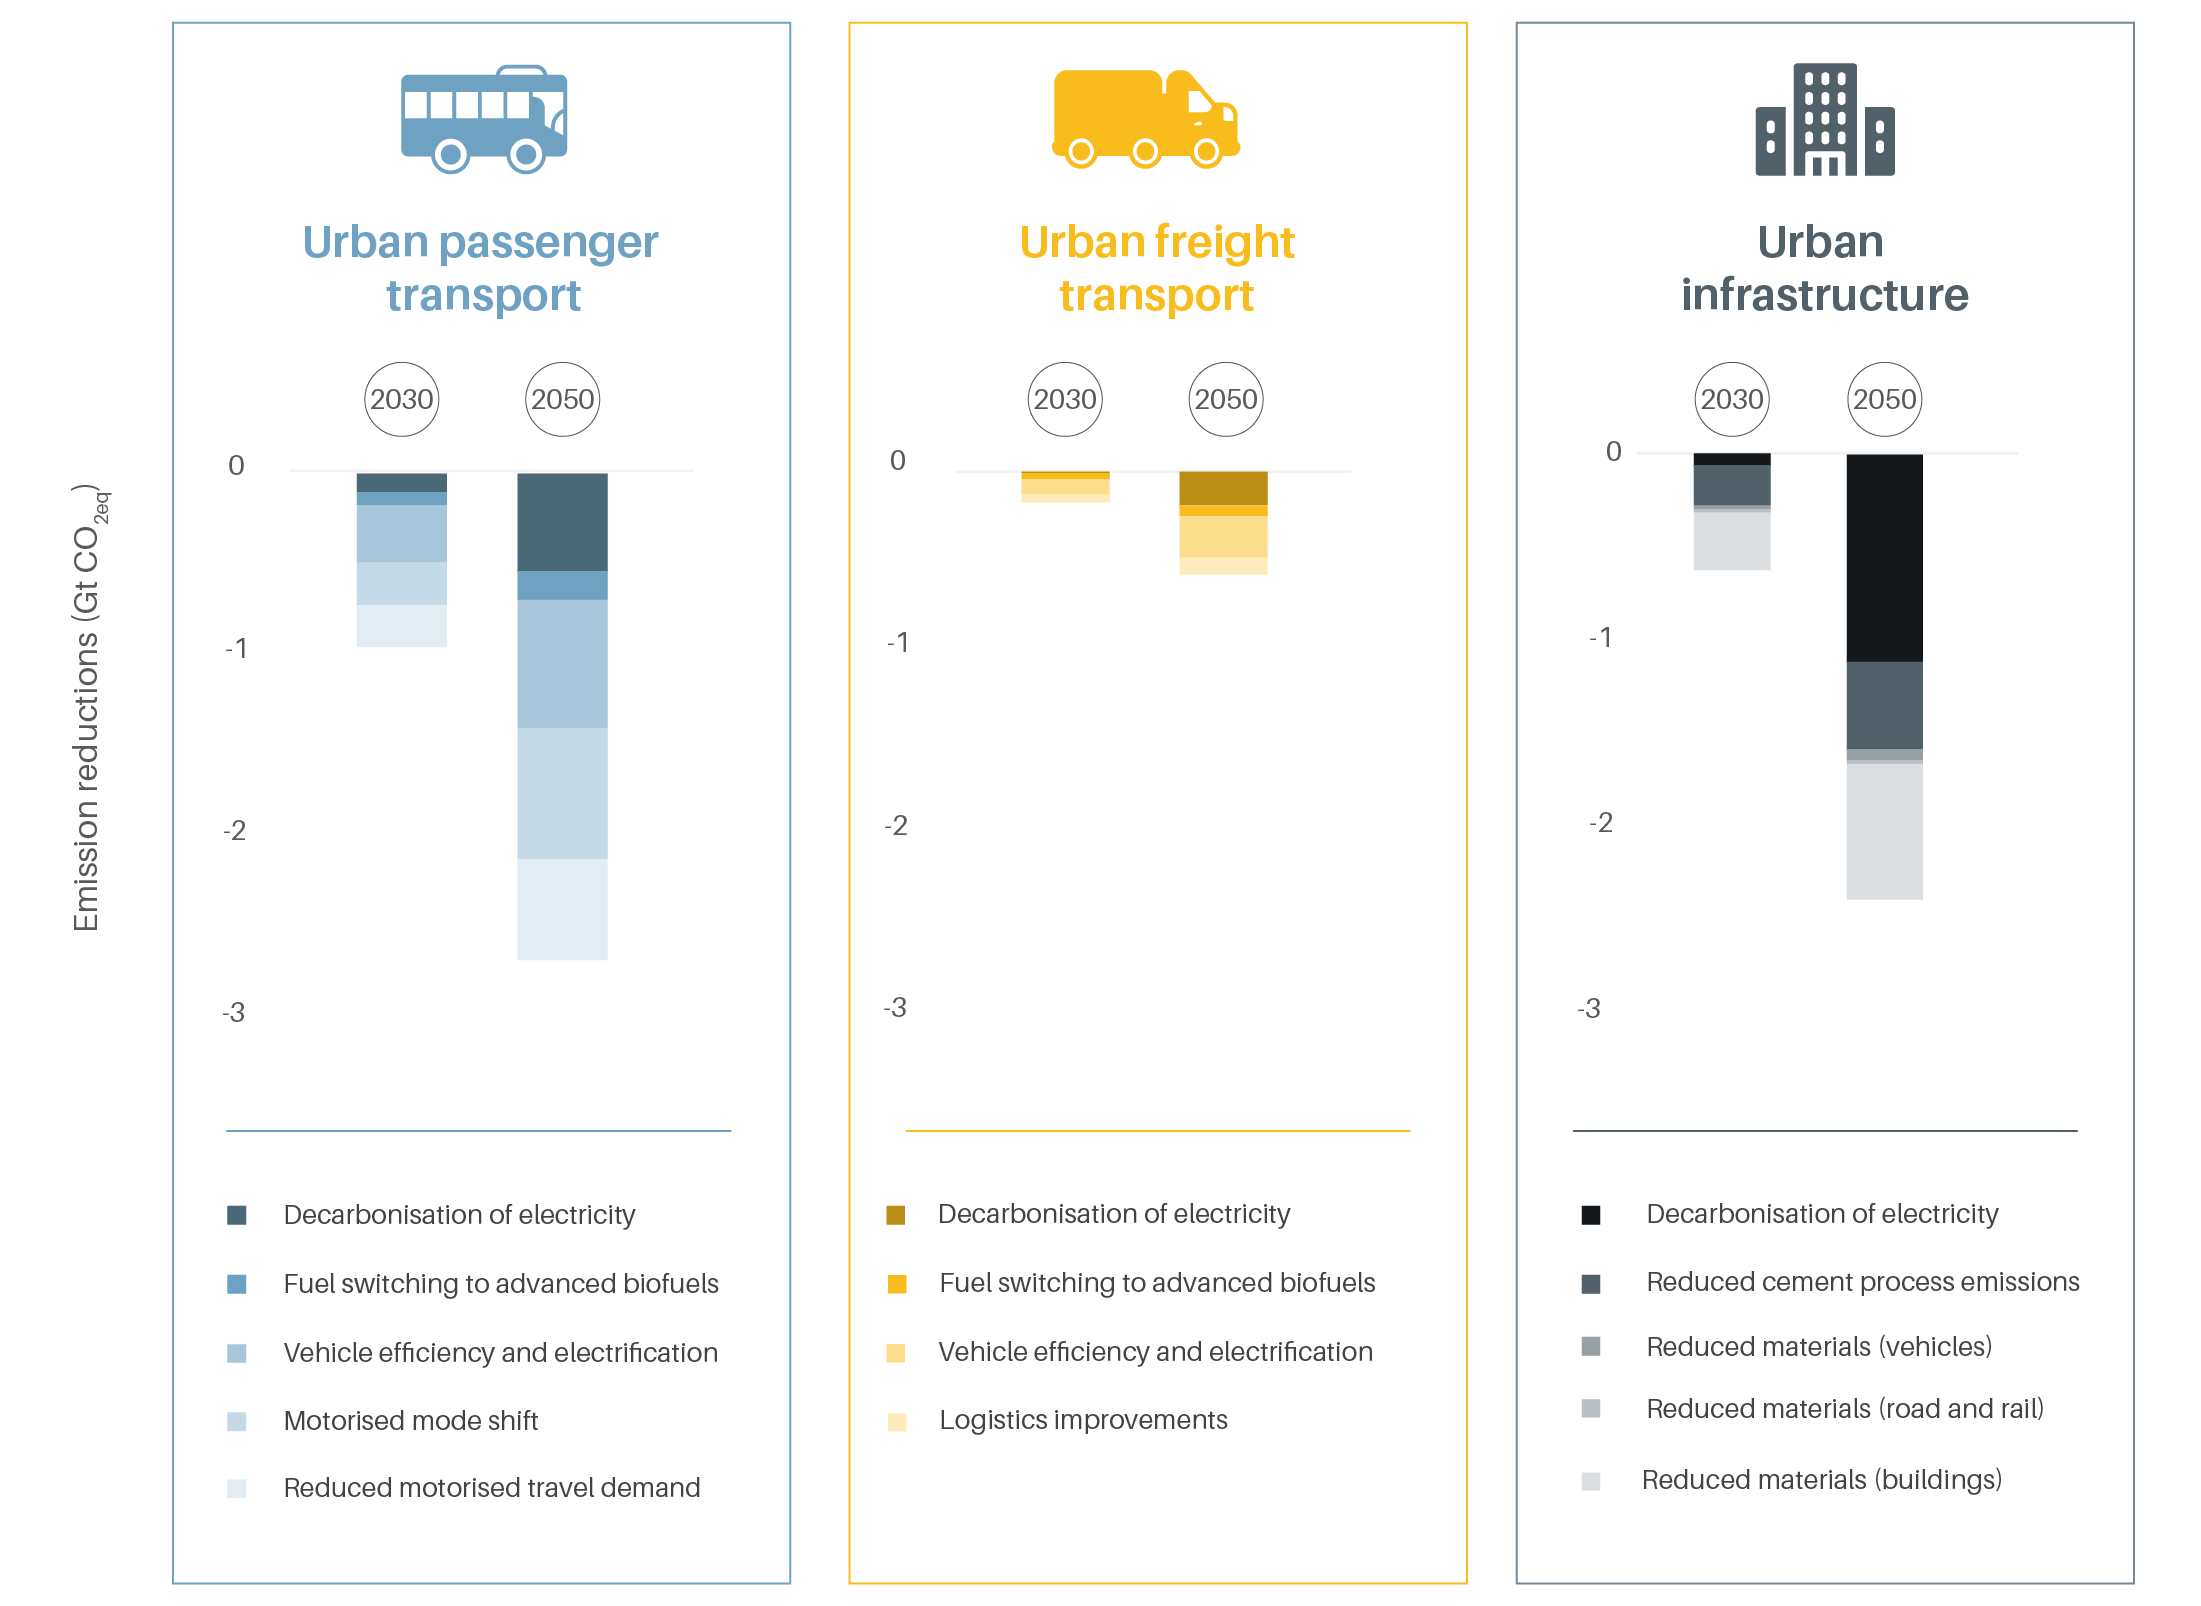
Figure 6.
Projections for global electric vehicle fleet development, 2020-2030
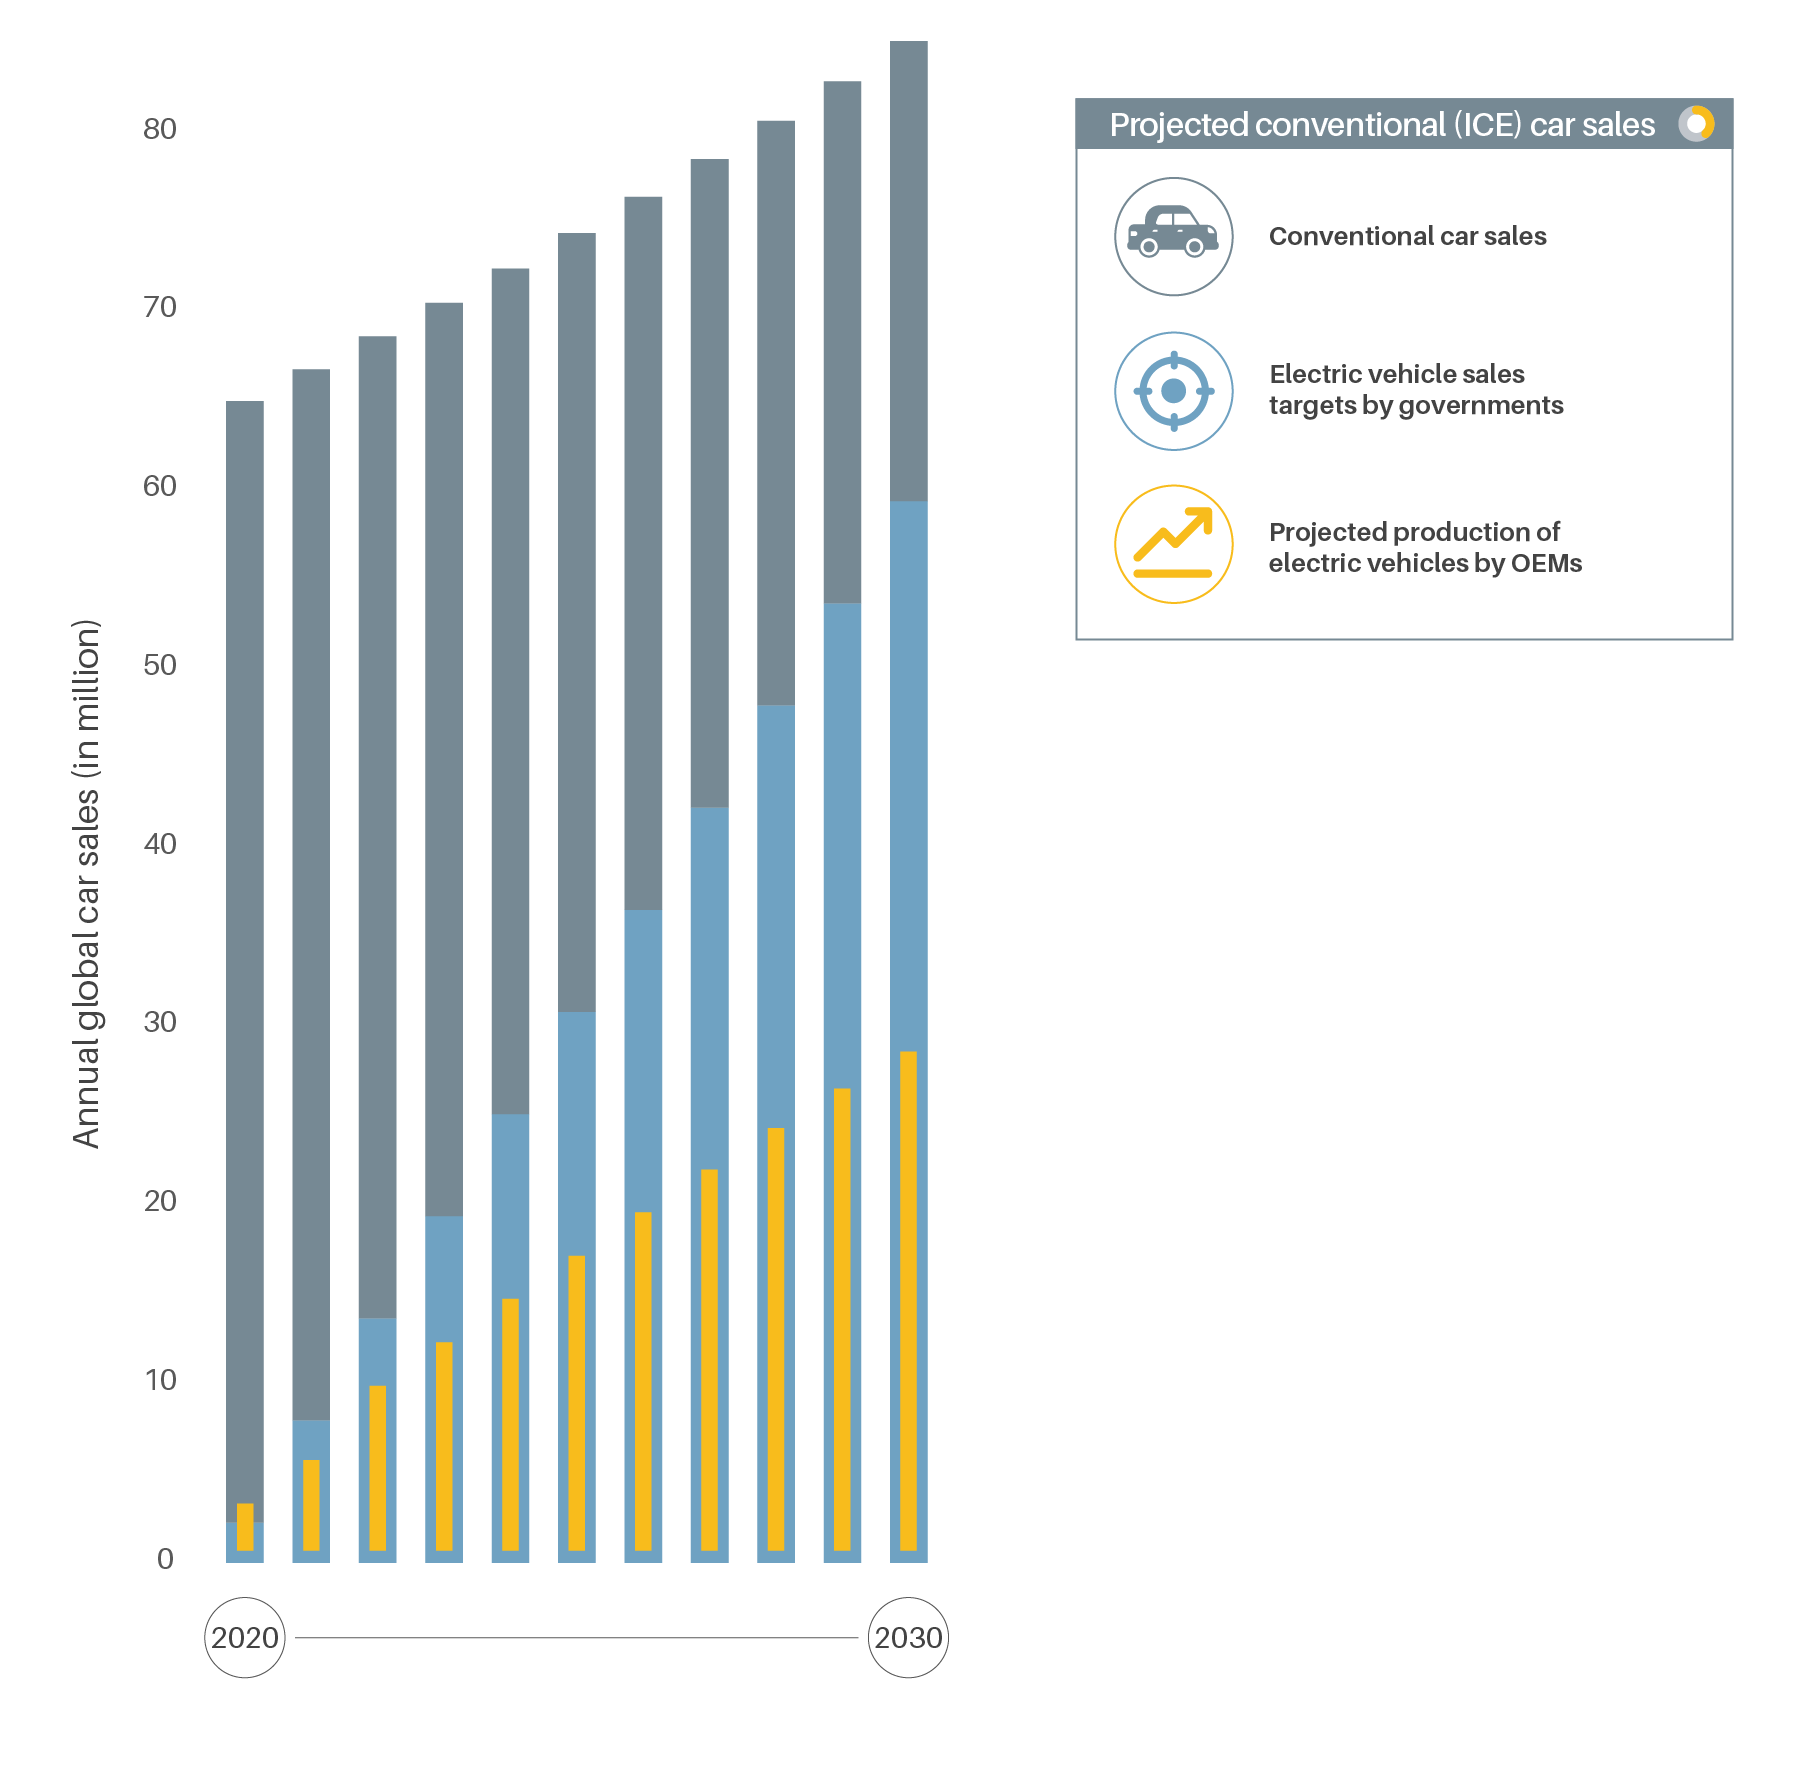
- A comparison of national electric vehicle sales targets with manufacturers’ plans for producing the vehicles suggests that a significant gap will remain between supply and demand through 2050.
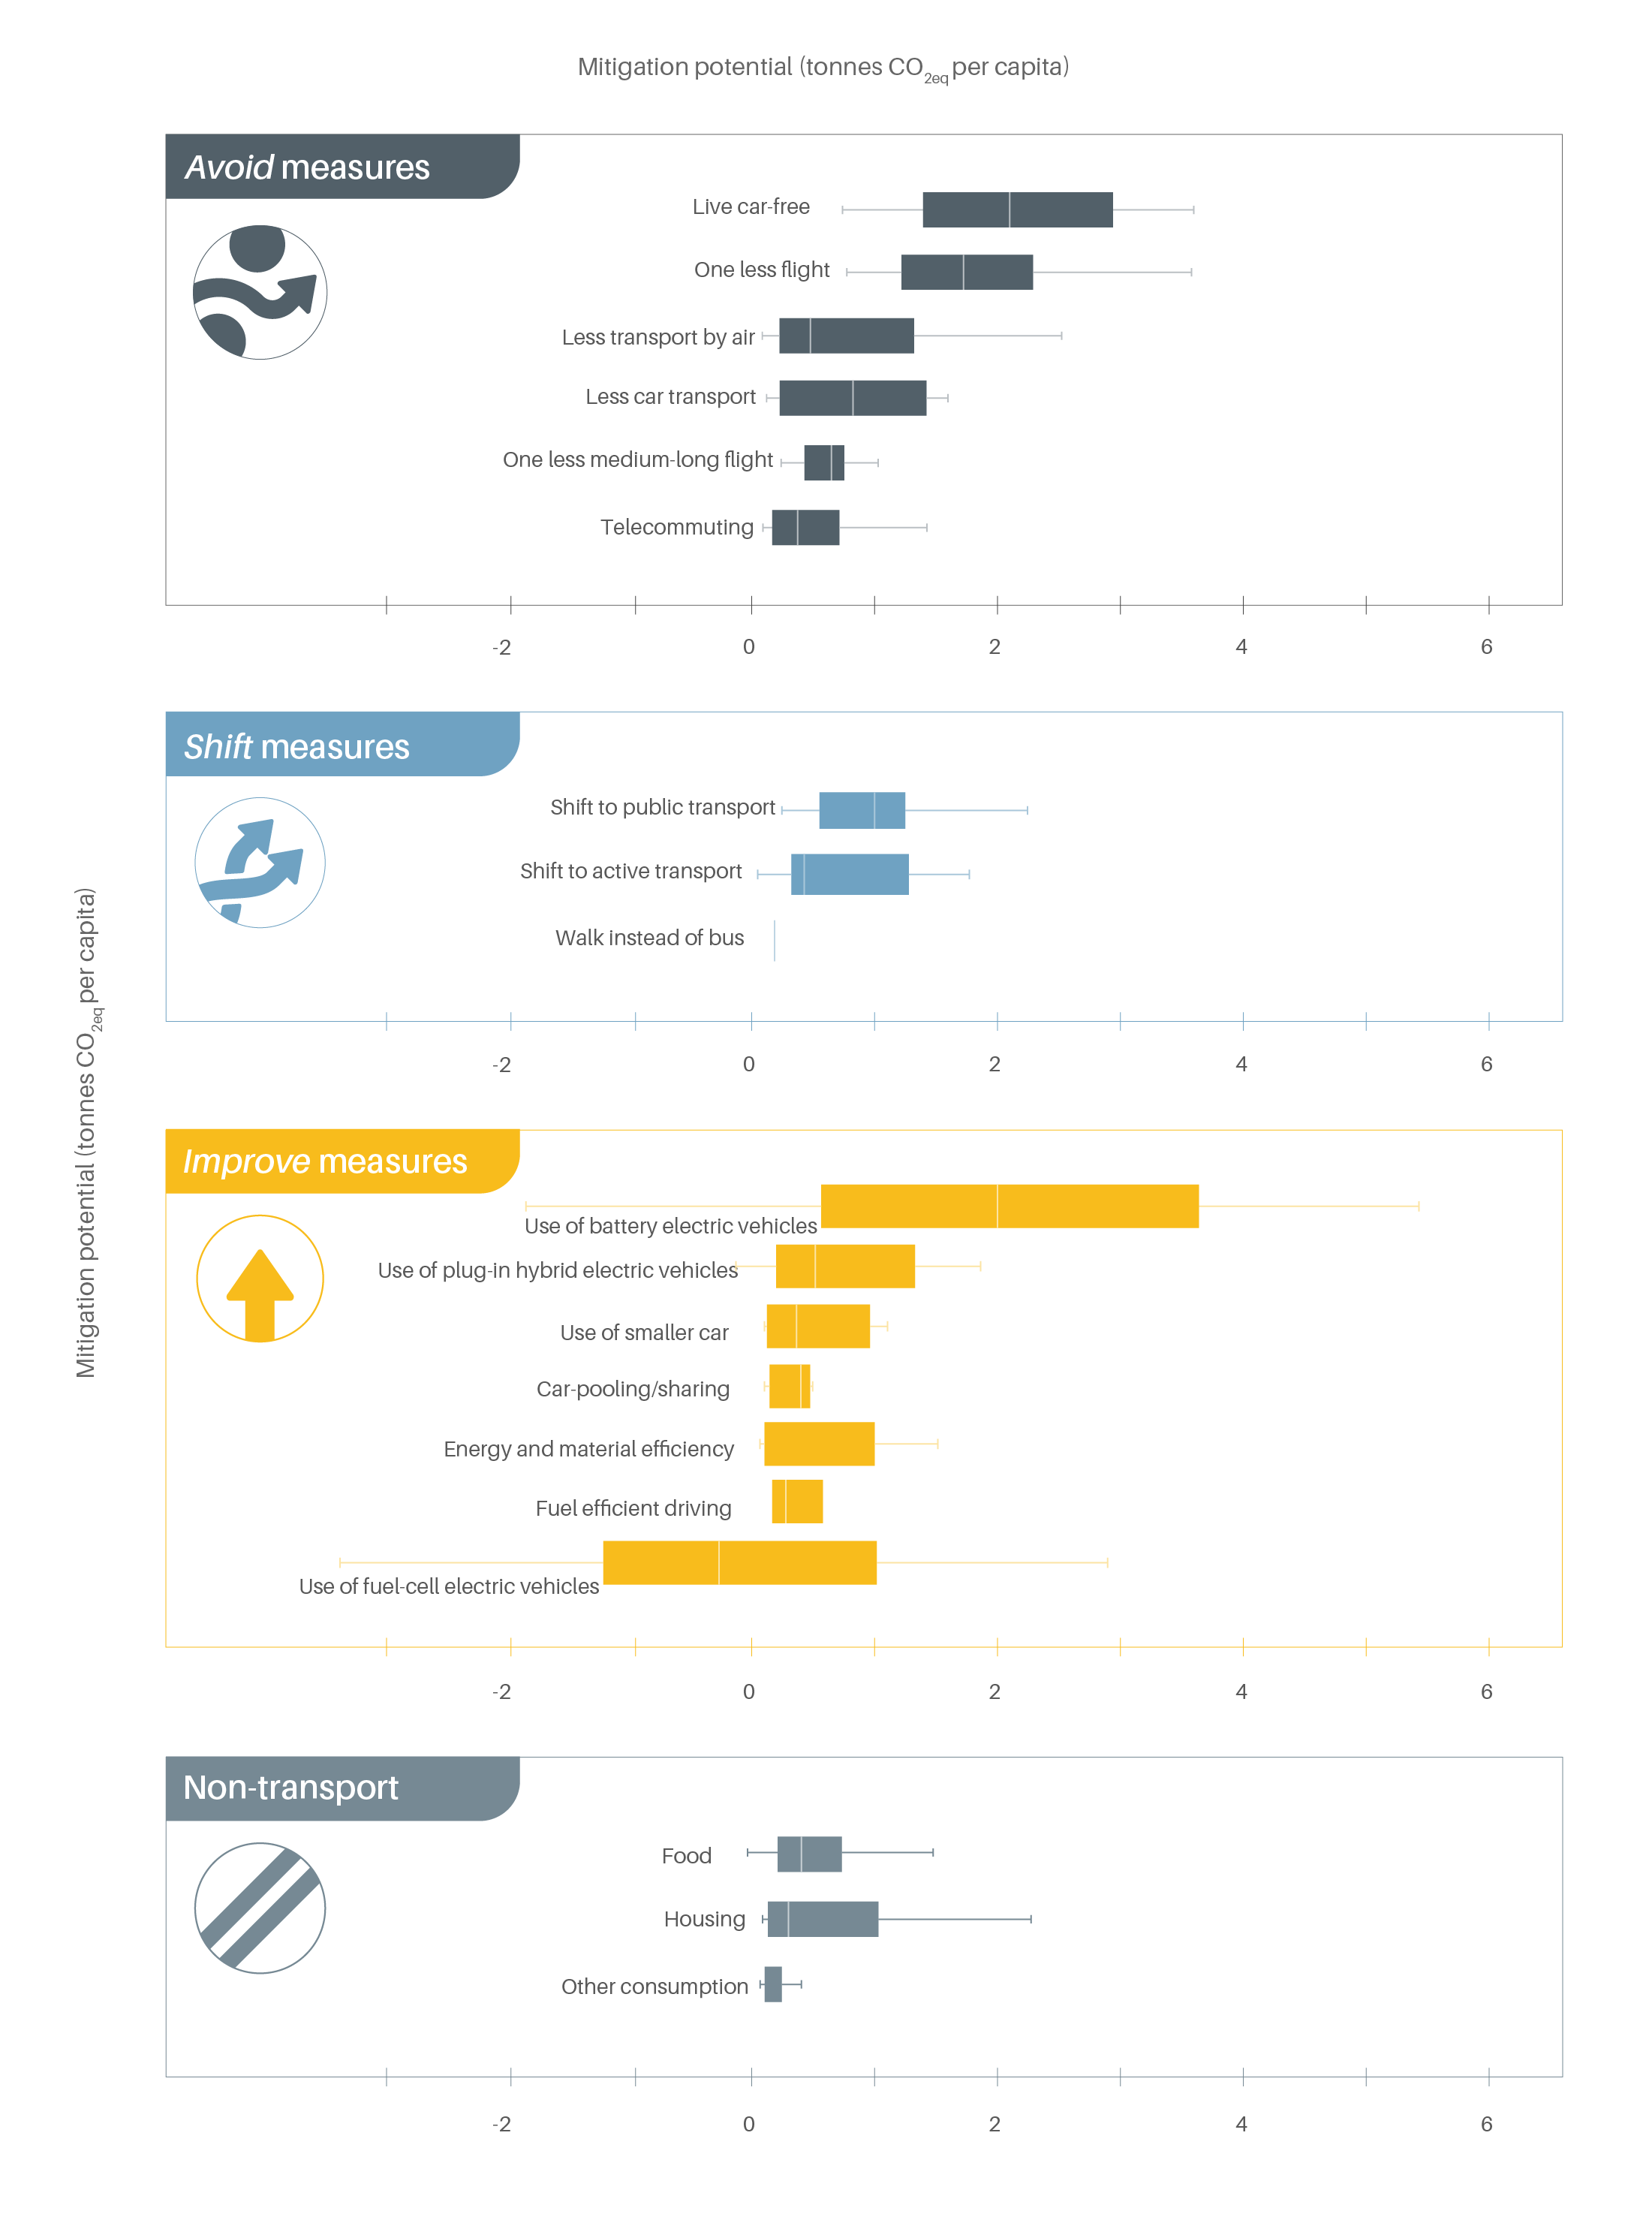
An analysis of personal consumption options has identified low carbon transport choices as the most effective area for reducing emissions, well above shifts in food, housing and other sectors.
Figure 7.
Emission mitigation potential of various low carbon transport options
