Passenger and Freight Railways
Note: The focus of this section is on long-distance passenger and freight railways; for a discussion of urban rail systems, see Section 3.4 on Urban Passenger and Freight Transport.
Passenger railways are a backbone of long-distance mobility networks, providing commuter, regional and inter-city services across different regions of the world. Demand for long-distance passenger rail is growing in many countries, driven by the rapid development of high-speed rail globally. This trend is expected to increase with emerging investments in high-speed rail networks in Africa, Asia and the Middle East.
Freight railways are a key driver of global trade and regional economic activity. Rail freight is more cost effective per tonne-kilometre than road freight and causes fewer traffic fatalities and less noise pollution. Railways facilitate inter-modal freight, providing efficient transport for the bulk of a trip and then allowing more flexible transport modes, such as trucks and cargo bikes, to complete deliveries to a final destination.
Railways are the most energy efficient means of long-distance passenger and freight transport on land. Although railways carry 8% of the world’s passengers and 8% of global freight tonnes, they account for only 3% of total transport energy demand and produce only 0.3% of global direct CO2 emissions.
The COVID-19 pandemic led to strong reductions in rail passengers and rail freight in the first six months of 2020, but recovery packages support the modernisation of railways and a shift from air travel to railways.
Key Findings
-
Demand trends
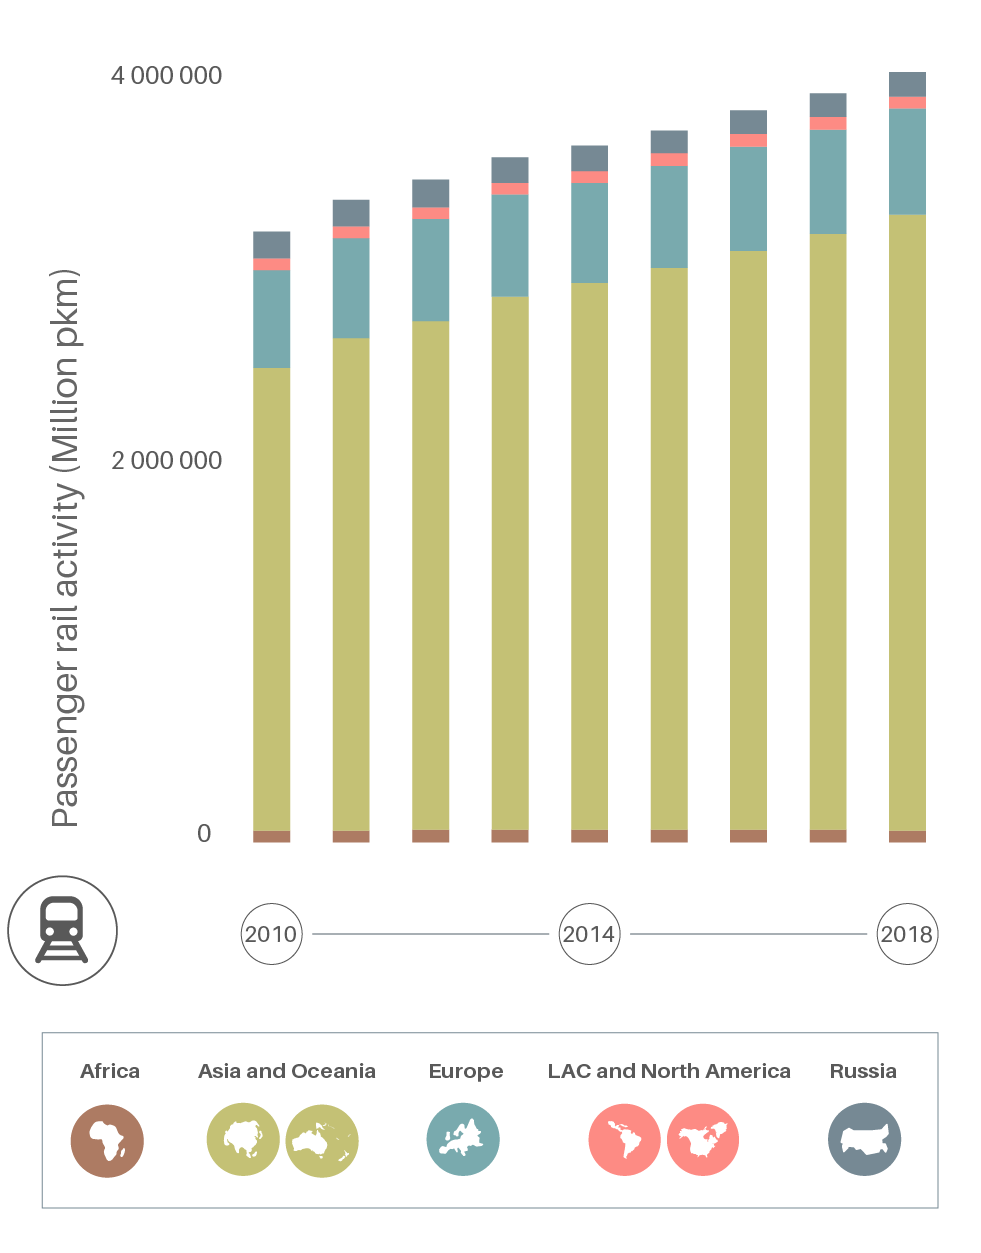
Global passenger rail activity grew 6% between 2016 and 2018, to 4 billion passenger-kilometres.
Figure 1.
Passenger rail activity by region, 2010-2018
The share of high-speed rail in global inter-city passenger rail activity doubled between 2010 and 2019, rising from 10% to 20%.
Figure 2.
Development of high-speed rail by country, 2010-2019
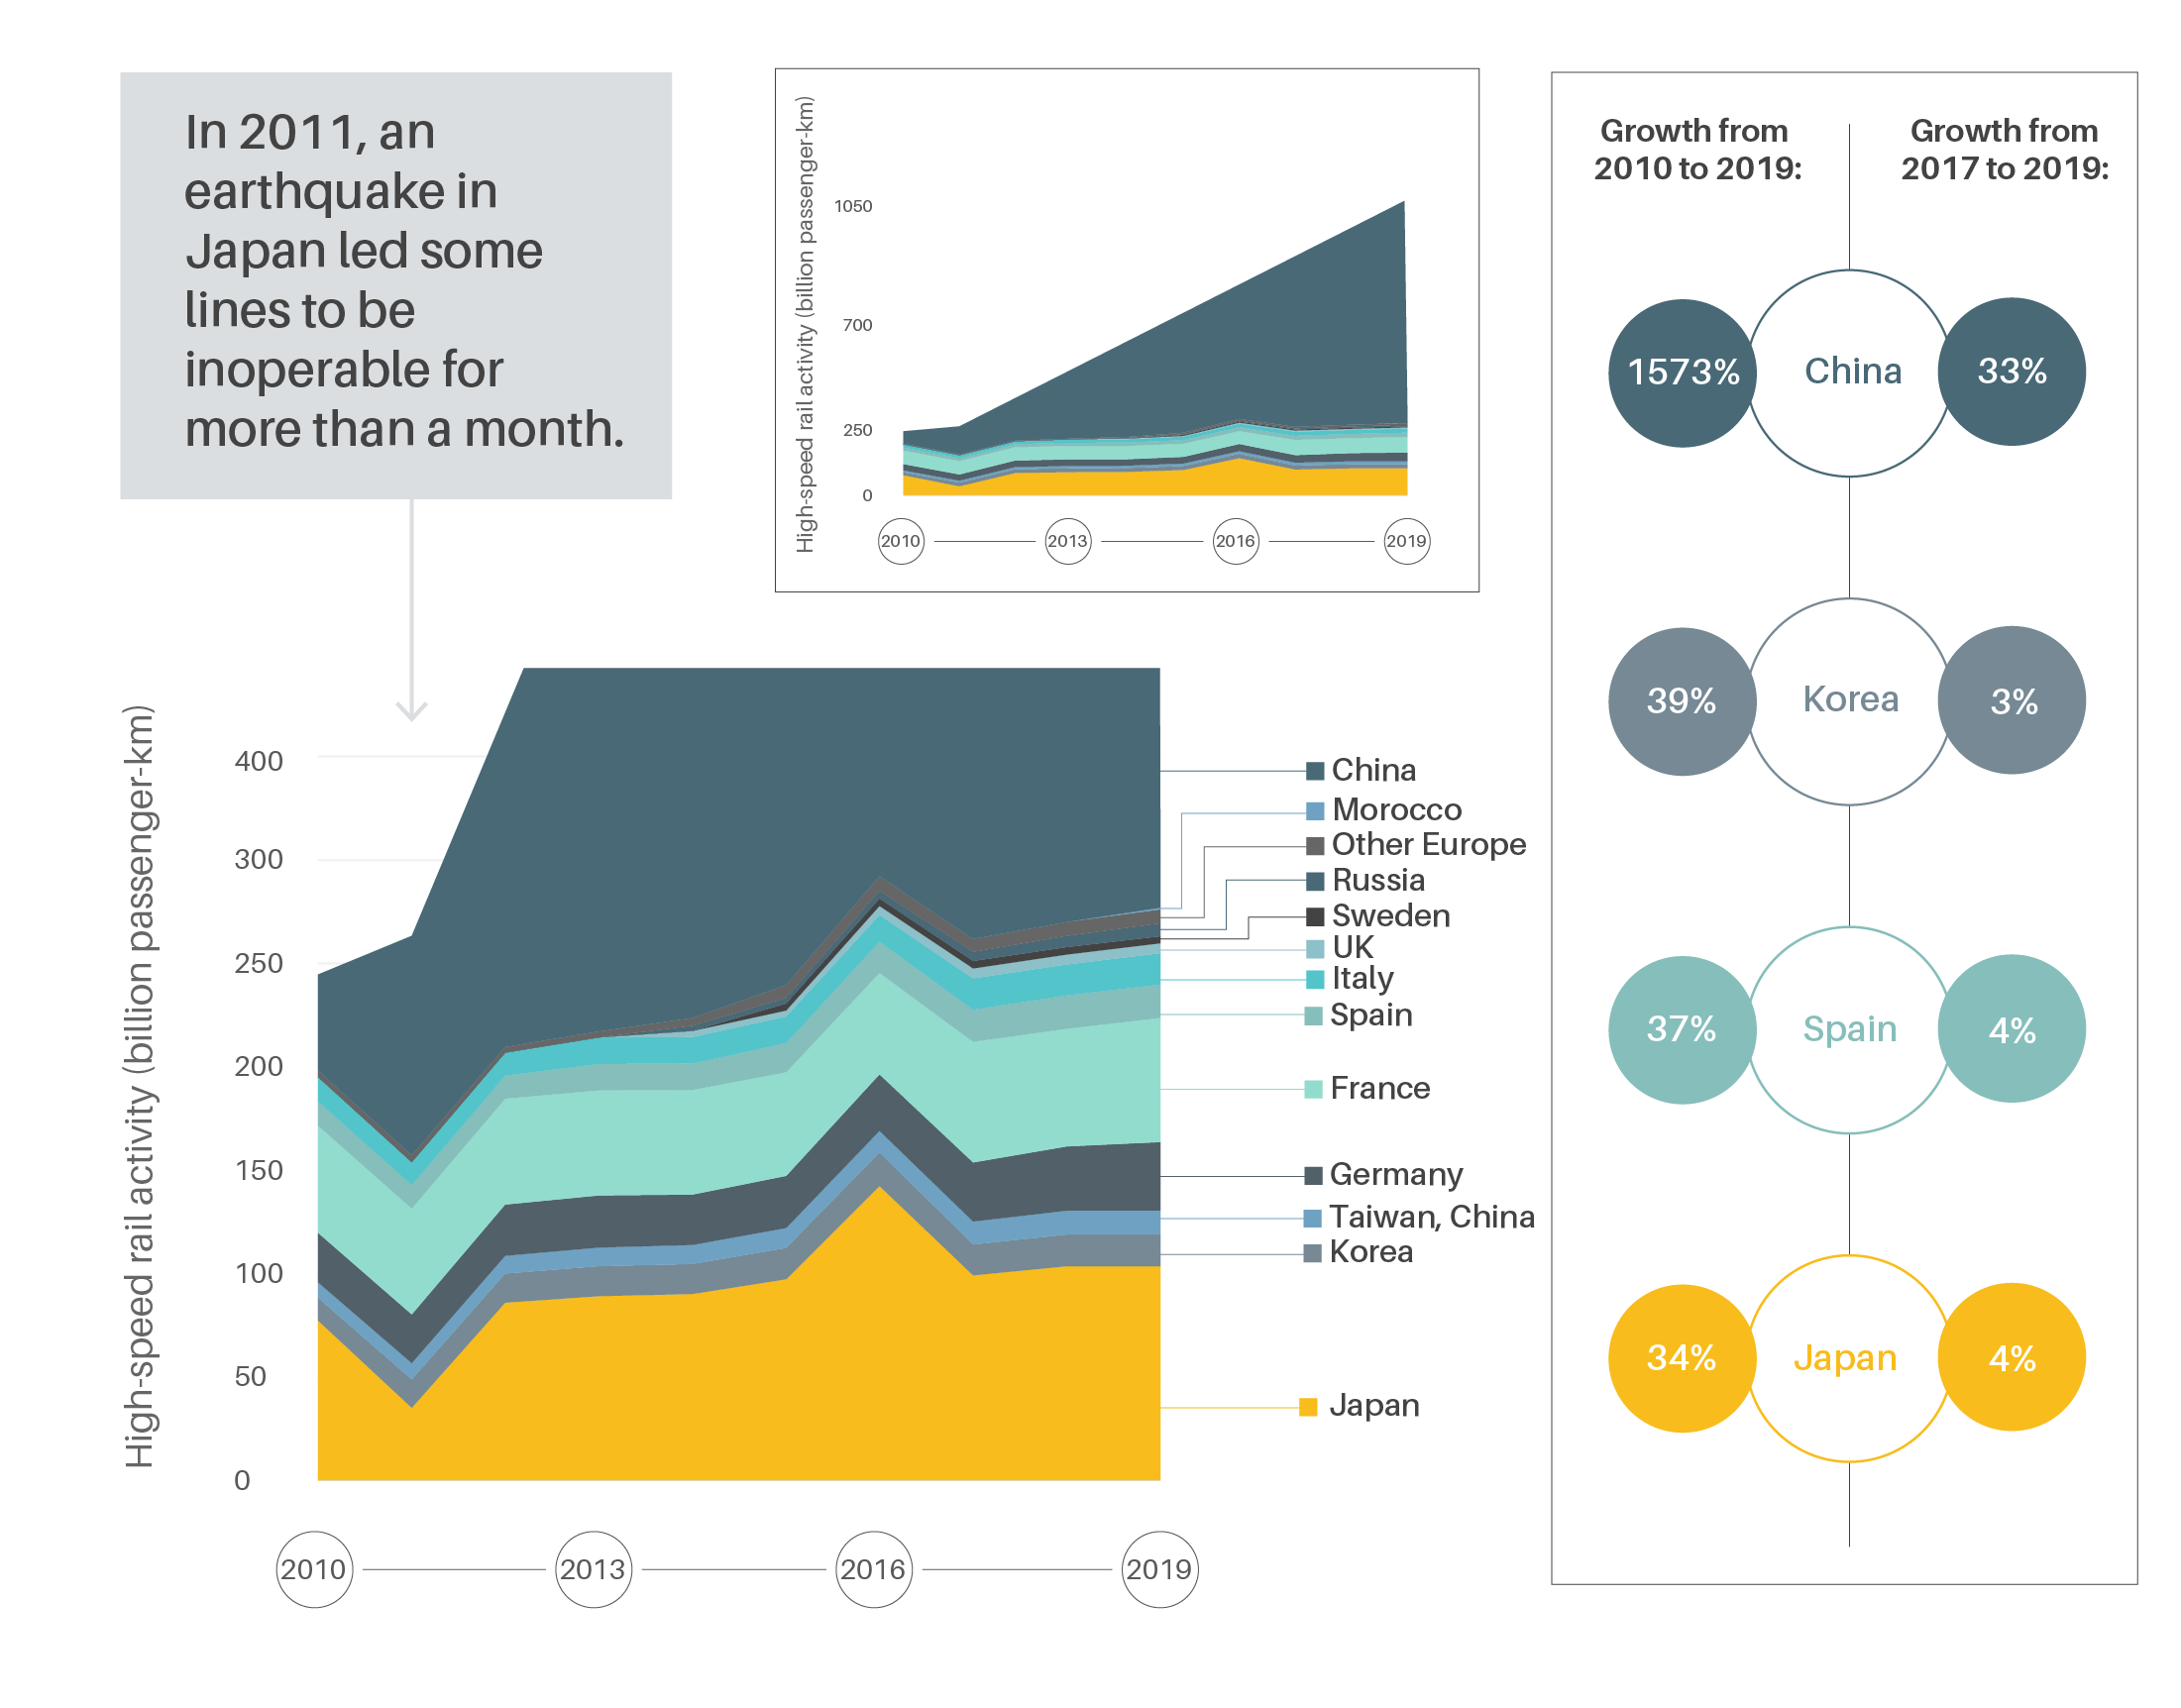
Although high-speed rail accounts for only 2% of the global rail network, it transports one-quarter of all rail passengers. For distances up to 1,200 kilometres, high-speed rail competes with air transport.
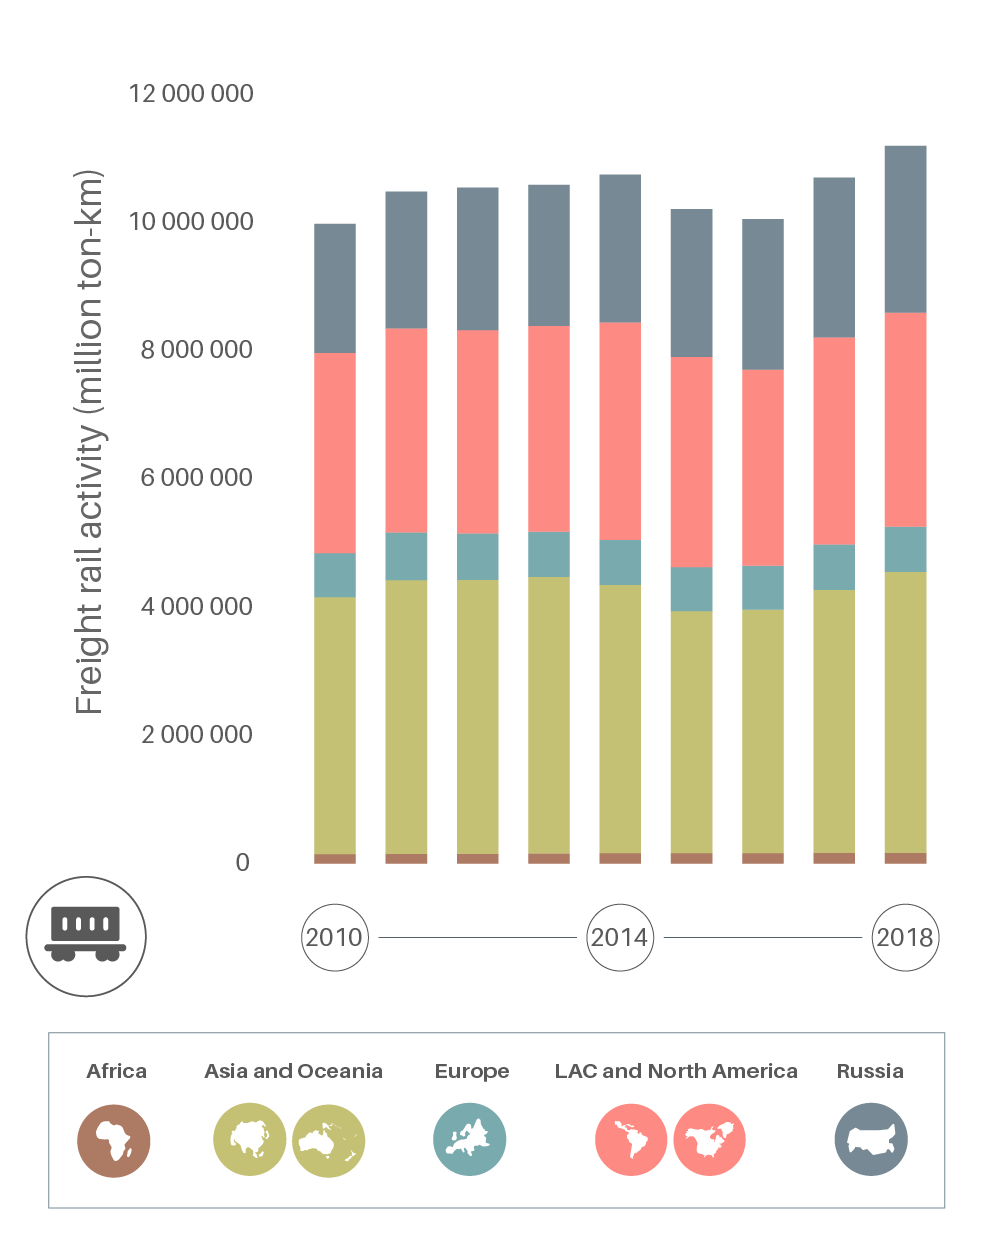
Rail freight activity increased 12% between 2010 and 2018, reaching a total of 11 trillion tonne-kilometres.
Figure 3.
Freight rail activity by region, 2010-2018
-
Emission trends
The carbon intensity of rail transport dropped to around 14 grams of carbon dioxide (CO2) equivalent per passenger-kilometre in 2019, less than one-tenth of the energy consumed by larger cars or airplanes.
The share of electrified railways worldwide increased from 36.7% in 2015 to 40.2% in 2019. In 2020, three-quarters of passenger rail activity was on electrified systems, up from 60% in 2000.
Nearly one-quarter of the electricity used to power electric trains is estimated to come from renewable sources, which supplied 9% of total global rail energy in 2015 (latest available data).
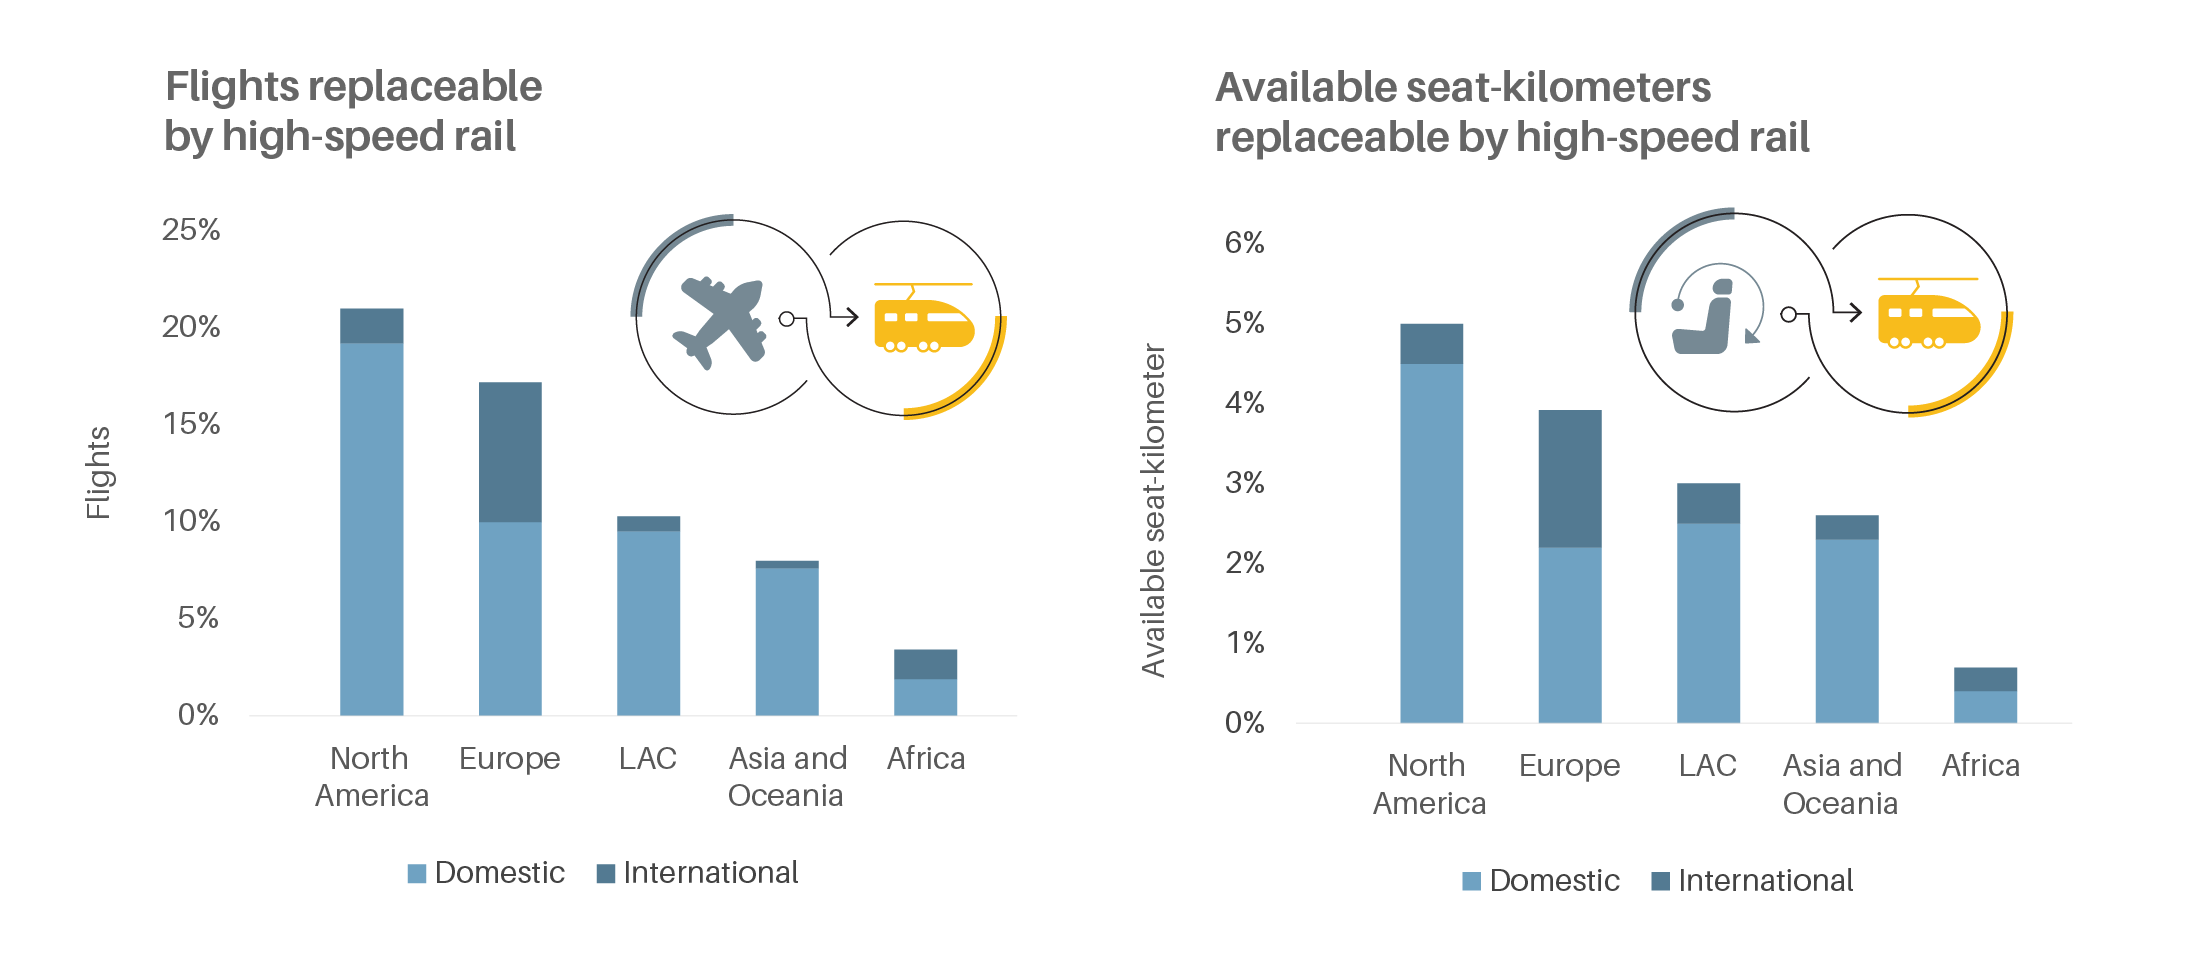
Shifting from air travel to high-speed rail produces 3.4 times less pollution and uses 80-90% less energy.
Figure 4.
Potential of high-speed rail to displace air travel, by region
Scaling up the use of fuels such as green hydrogen can increase the efficiency of passenger and freight railways.
-
Policy Measures
Ambitious national rail investment programmes are reinvigorating passenger and freight rail systems, with significant investments in emerging economies in Asia and Latin America.
New and expanding high-speed rail services in the Global South are outpacing investments in the Global North.
As of 2020, there were 29 railway projects under China’s Belt and Road Initiative, which aims to promote infrastructure across Africa, Asia and Europe; this has catalysed an increase in cross-border rail investments to accelerate economic integration.
A shift from air travel to high-speed rail could displace 21% of domestic and international flights in North America, 10% of domestic flights in Europe and 9% of domestic flights in Latin America.
-
Impacts of the COVID-19 pandemic
Passenger rail demand fell an estimated 8% during the first six months of 2020, while freight rail demand stayed at similar levels in all regions.
In the first six months of 2020, the rail sector lost an estimated USD 36 billion globally due to the pandemic.
Passenger rail demand is expected to recover steadily from COVID-19 impacts, with global average annual growth of 2.3% projected through 2025.
Several national governments have announced plans to implement recovery measures to support and prioritise the competitiveness of railways.
Around one-third of transport spending in recovery packages in G20 countries is allocated to green investment (USD 103 billion), with 26% of this amount for rail, exceeding investment in electric vehicles and alternative fuels (18%) and airlines and ports (13%).
Key indicators
2017*
2019*
% change
Key indicators
(# of countries)
2017*
2019*
% change
Key indicators
2017*
2019*
% change
Key indicators
2017*
(2016)
2019*
(2018)
% change
Key indicators
2017*
2019*
% change
Key indicators
2017*
(2016)
2019*
(2018)
% change
Key indicators
2017*
(2016)
2019*
(2018)
% change
Key indicators
2017*
(2016)
2019*
% change
Key indicators
2017*
(2018)
2019*
% change
Key indicators
2017*
(2015)
2019*
(2018)
% change
Key indicators
2017*
2019*
% change
(*) Data are for the indicated year unless noted otherwise.
