Aviation
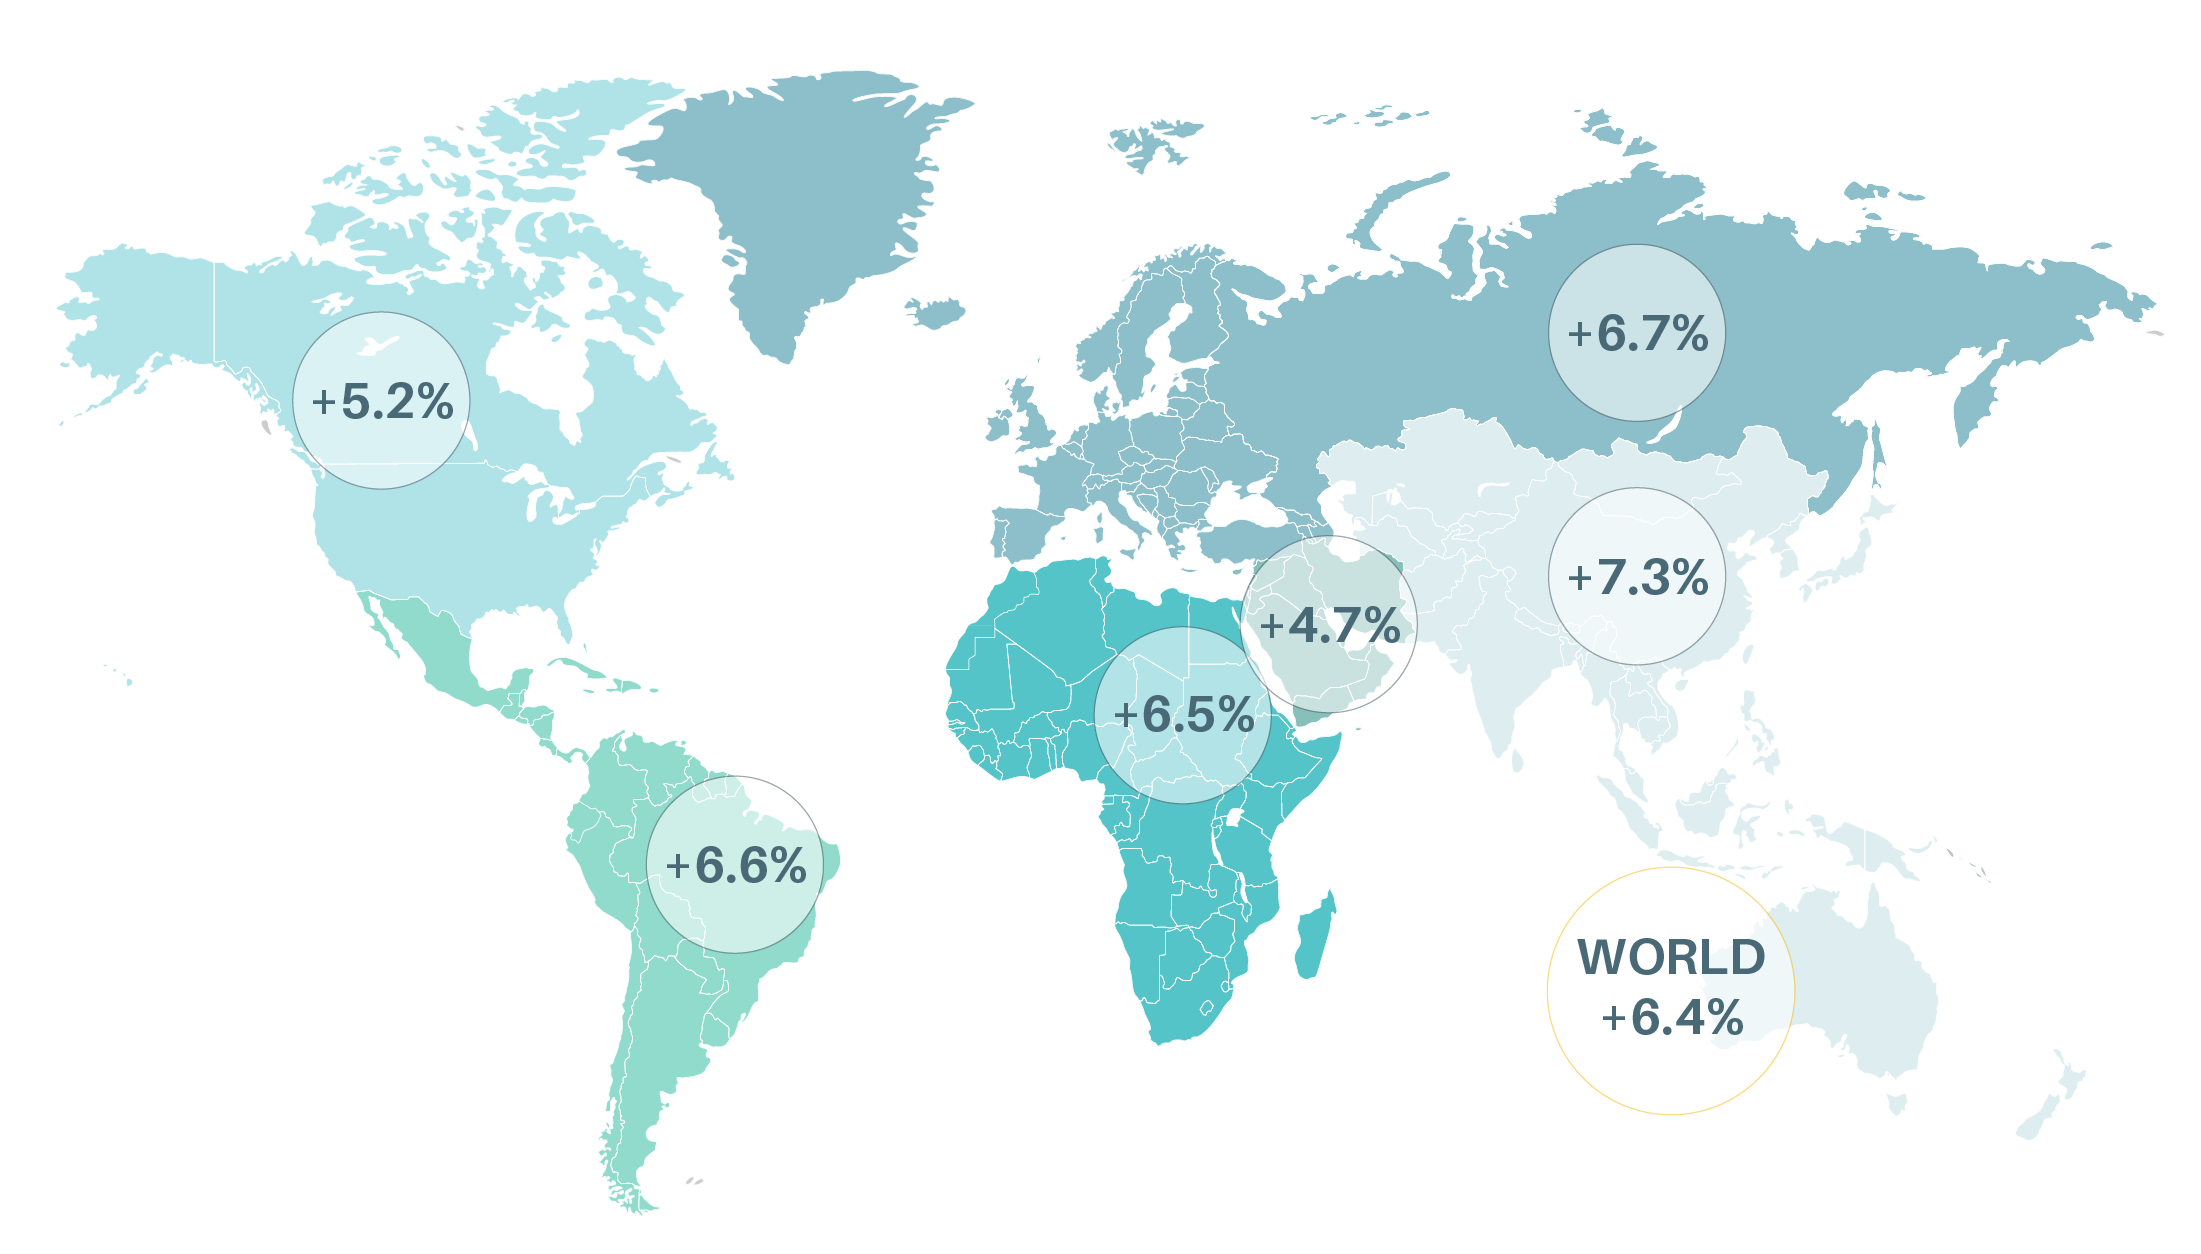
Aviation started 2020 on an upward trend, after global demand for flying grew 6.1% in 2018 led by Asia, Europe and Latin America. With the demand for air travel growing rapidly, calls accelerated in 2019 for the International Civil Aviation Organization (ICAO) to introduce stricter restrictions on carbon offset credits under the market-based Carbon Offsetting and Reduction Scheme for International Aviation (CORSIA), which has been criticised for lacking ambition.
As the COVID-19 pandemic spread in early 2020, aviation demand plummeted, and the ICAO predicted that global passenger traffic for the year could drop by 1.9 million to 3.2 million passengers, with a 33% to 60% reduction in seats (compared to business as usual) (see Box). As recovery plans began taking shape, a few European governments linked airline bailout packages to sustainability conditions, but most did not, underscoring the limitations of individual commitments. Although CORSIA initially sought to rely on average aviation emissions in 2019 and 2020 as the baseline for its annual offsetting requirements, the ICAO Council later opted to exclude 2020 data in light of the short-term decline in flights due to the pandemic.
Key Findings
-
Demand trends
Global demand for passenger air travel grew 6.1% in 2018, while demand for freight aviation declined 4.6%.
Figure 1.
Growth in passenger aviation, 2018
Passenger aviation demand continues to be driven by generous subsidies on airline fuels and airport infrastructure as well as value-added tax exemptions on international flights.
Biofuels provided only around 0.01% of aviation fuel demand in 2019. Sustainable aviation fuels must be scaled up significantly to make a substantive impact on aviation emissions.
-
Emission trends
Passenger and freight aviation were responsible for around 2.5% of global energy-related carbon dioxide (CO2) emissions in 2018.
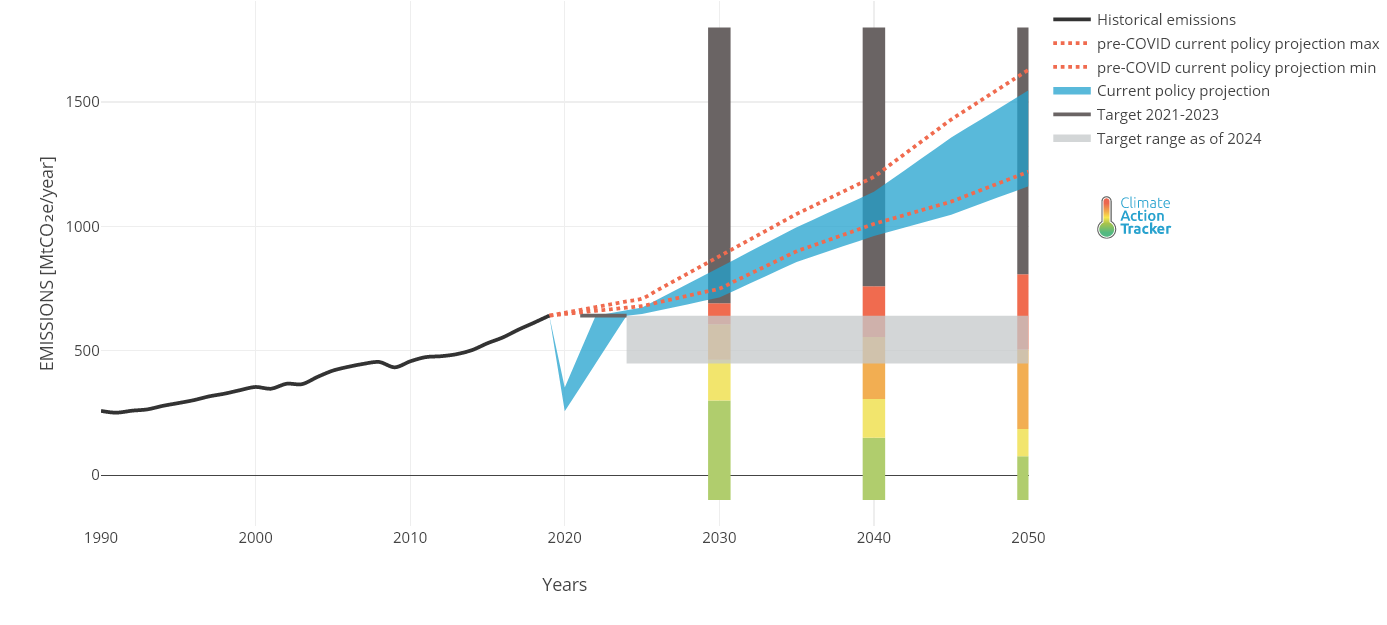
Figure 2.
Pre- and post-COVID-19 projections for aviation emissions to 2050
Incremental efficiency gains in operations and aircraft continue to be outpaced by global demand for air travel.
Figure 3.
Fuel economy in aircraft, 2000-2020
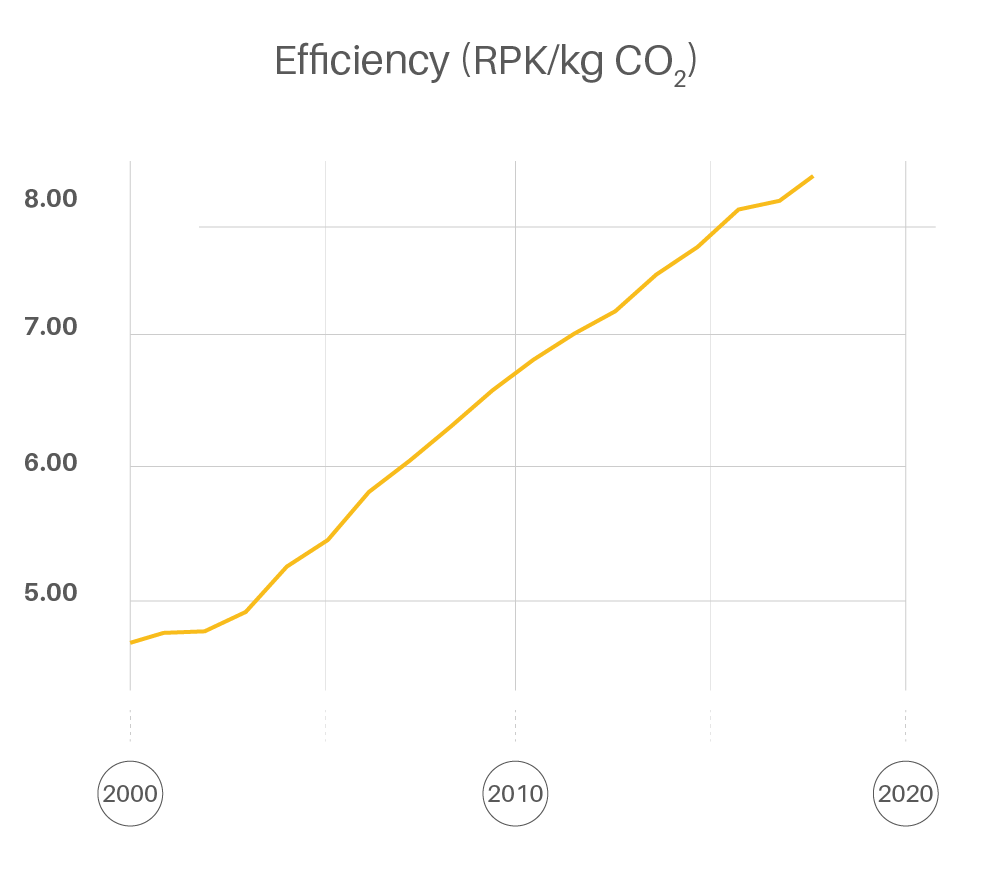
Figure 4.
Fuel economy (litres/100 kilometres) per seat by flight type, 1981-2020
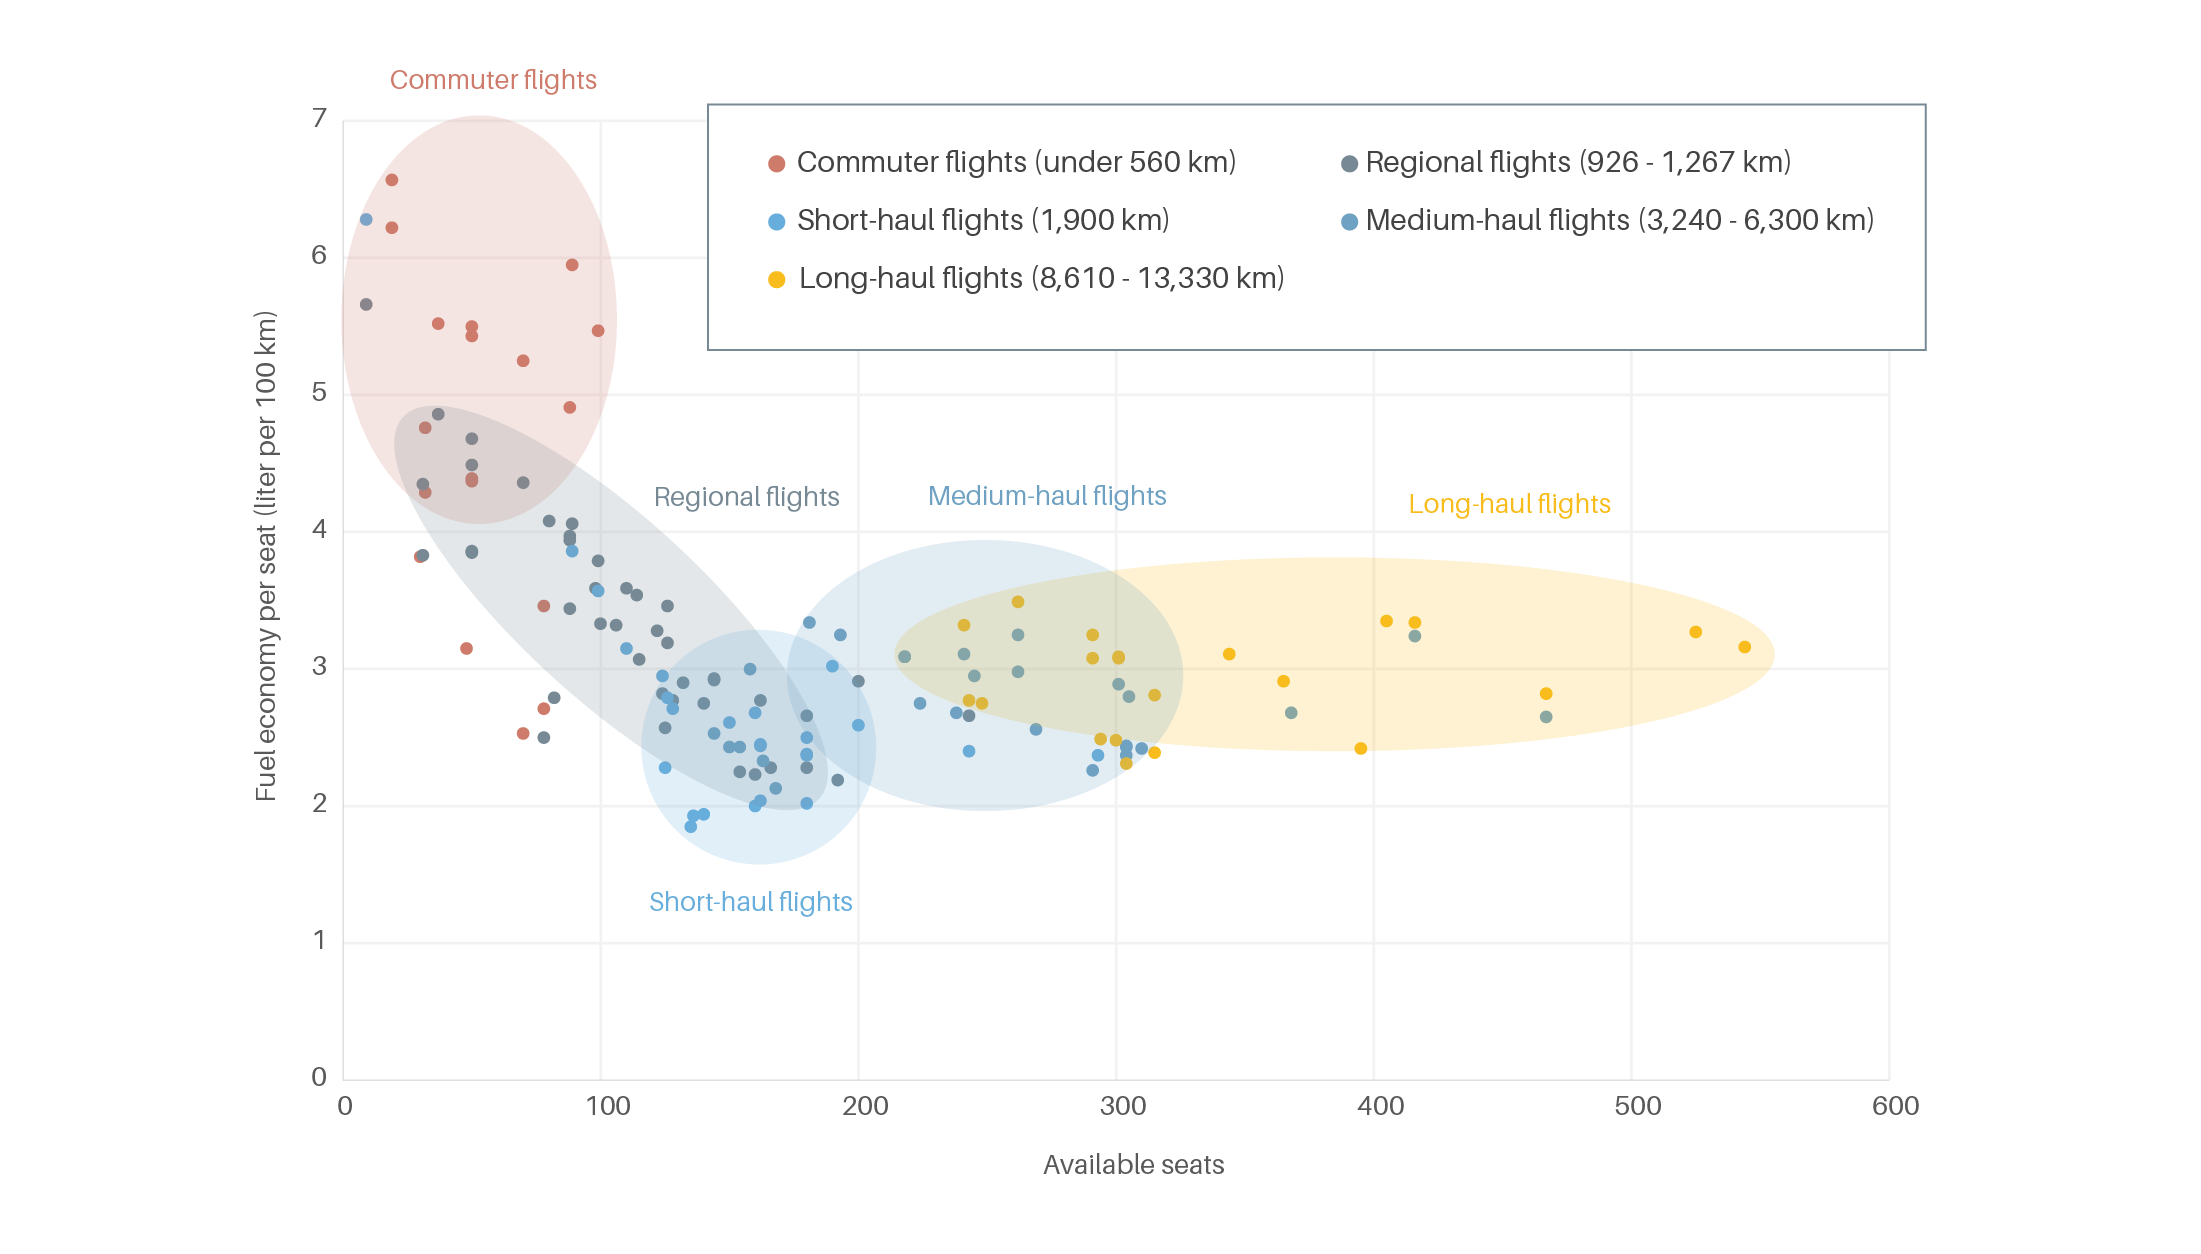
Non-CO2 emissions in aircraft contrails contribute twice as much to climate change as direct aircraft CO2
-
Policy Measures
The expansion of airline pricing measures is internalising a share of the external costs of aviation but remains insufficient to significantly influence consumer behaviour.
Airlines must significantly increase the ambition of their emerging commitments to reduce aviation emissions in order to meet Paris Agreement mitigation targets; they can have greater impact with more industry co-ordination, increased alignment with global targets and strengthened national ambitions.
Figure 5.
Aviation CO2 emission projections and potential greenhouse gas reductions to 2050

It is critical to complement “Improve” strategies in the aviation sector with appropriate “Avoid” and “Shift” measures.
The optimisation of complementary transit modes such as high-speed rail is reducing the demand for air travel in some countries, but additional investments and incentives are needed to make a global impact.
-
Impacts of the COVID-19 pandemic
The impacts of the pandemic on international flight capacity ranged from an estimated 37% reduction in Africa to 72% in Asia, although this near-term drop in flights is not expected to greatly alter emission trajectories.
Figure 6.
Impacts of the COVID-19 pandemic on international passenger traffic, 2020
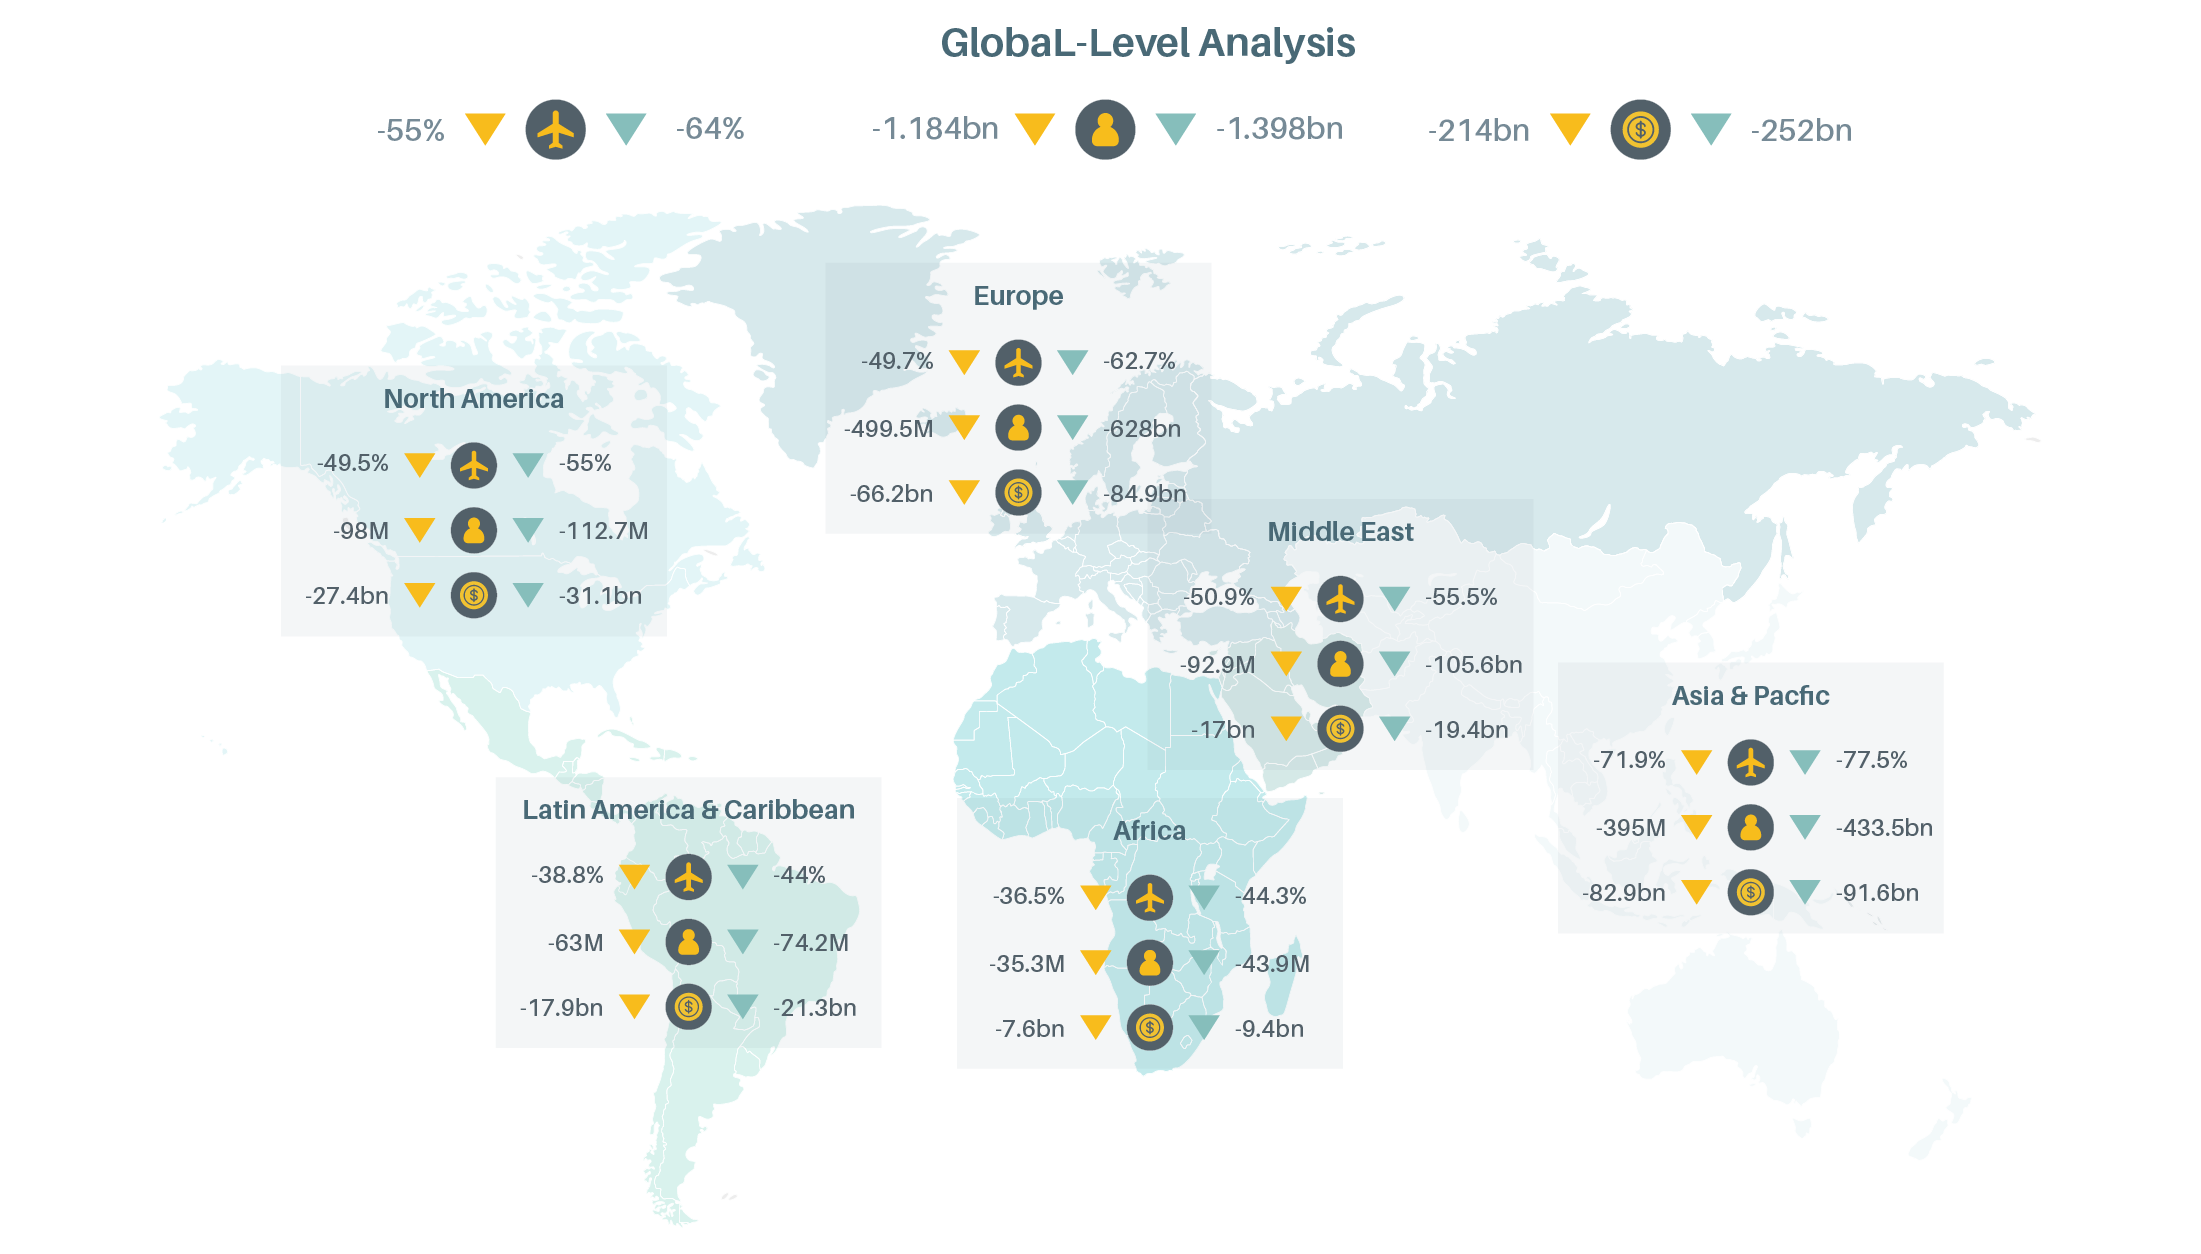
Pandemic recovery packages are reshaping discussions among airlines and governments on bailouts, taxes, fuel mandates and sustainability conditionalities.
The large impact of the COVID-19 pandemic on commercial aviation operations is likely to reduce the prioritisation of aviation policies on climate change – which were increasing before the pandemic – in favour of maintaining air connectivity for economic activity.
Key indicators
2018*
2019*
% change
Key indicators
2018*
2019*
% change
Key indicators
2018*
2019*
% change
Key indicators
2018*
2019*
% change
Key indicators
2018*
2019*
% change
Key indicators
2018*
2019*
% change
Key indicators
2018*
2019*
% change
Key indicators
2018*
2019*
% change
Key indicators
2018*
2019*
% change
(*) Data are for the indicated year unless noted otherwise.
