Oceania
Regional Overview
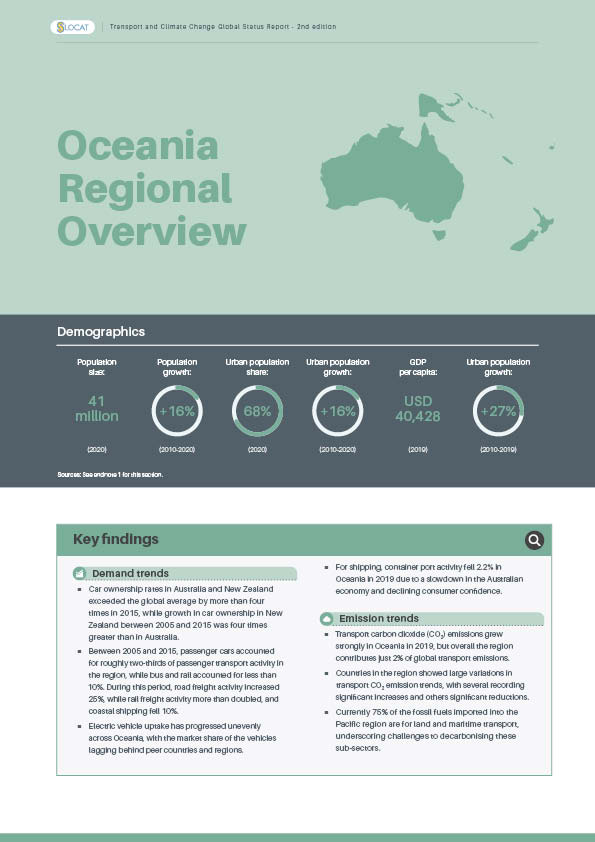
Population size
(2020)
Population growth
(2010-2020)
%
GDP growth
(2010-2019)
%
Total vehicle sales
growth (2010-2019)
%
Total transport CO2
emissions (2019)
Share of global transport
CO2 emissions (2019)
%
Oceania’s contribution to global transport demand and transport emission growth has remained low compared to other regions. Aviation and shipping are important drivers of transport demand and emissions because the region comprises many dispersed small island nations; as a result, it has been heavily dependent on fossil fuels and is taking steps to reduce this reliance.
Small island developing states (SIDS) across the Pacific region have experienced increasing climate impacts to infrastructure due to rising emissions, with transport assets being among the most valuable and vulnerable. Strategies to decarbonise transport in Oceania involve expanding sustainable aviation and shipping solutions and scaling up electric mobility, with high potential to be powered by ample renewable energy resources.
The COVID-19 pandemic has had severe socio-economic impacts on Oceania. Australia saw strong declines in public transport ridership in the early months of 2020, and SIDS suffered greatly from the collapse of fisheries and tourism.
Key Findings
-
Demand Trends
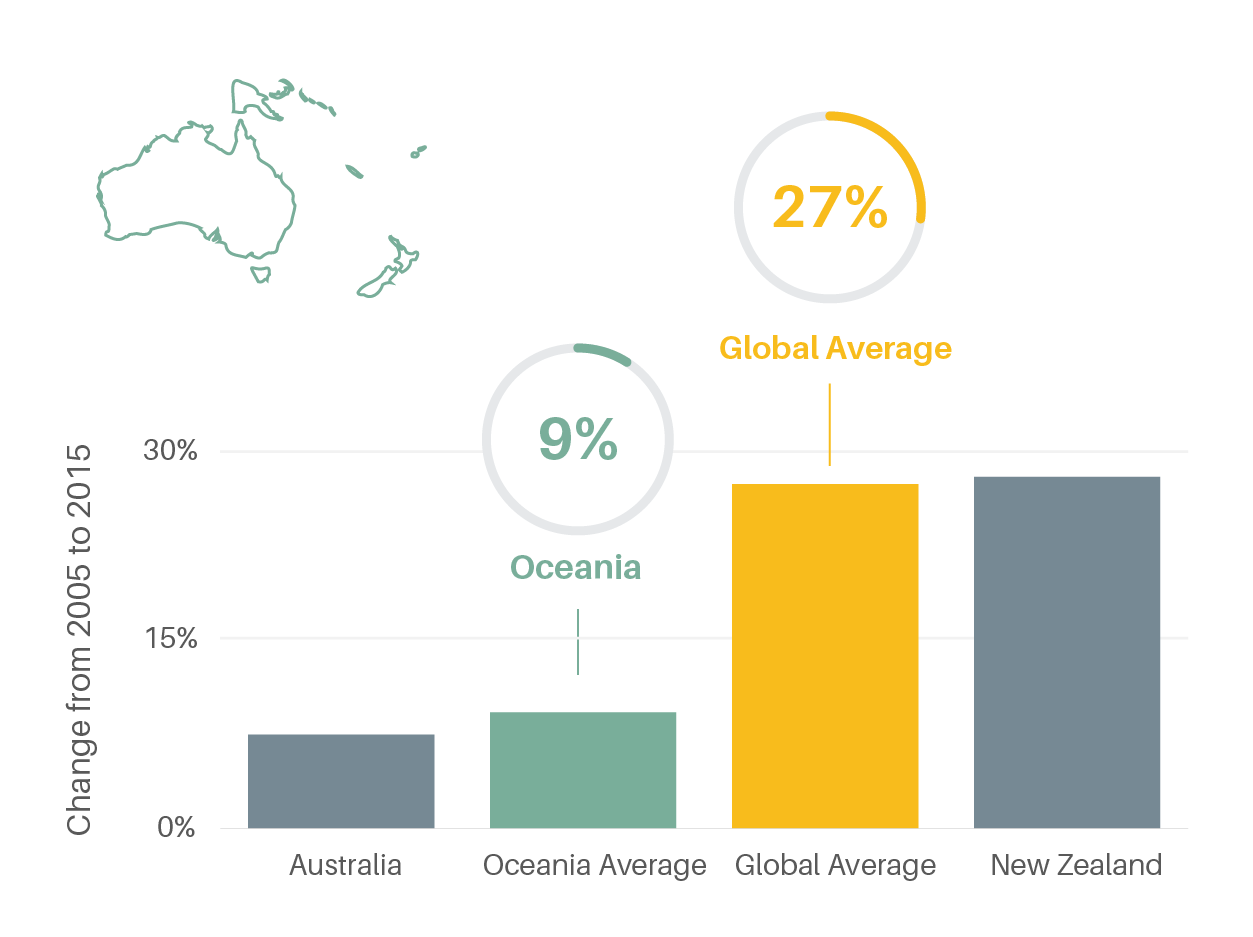
Car ownership rates in Australia and New Zealand exceeded the global average by more than four times in 2015, while growth in car ownership in New Zealand between 2005 and 2015 was four times greater than in Australia.
Figure 1.
Car ownership rates per 1,000 people in Oceania, 2015
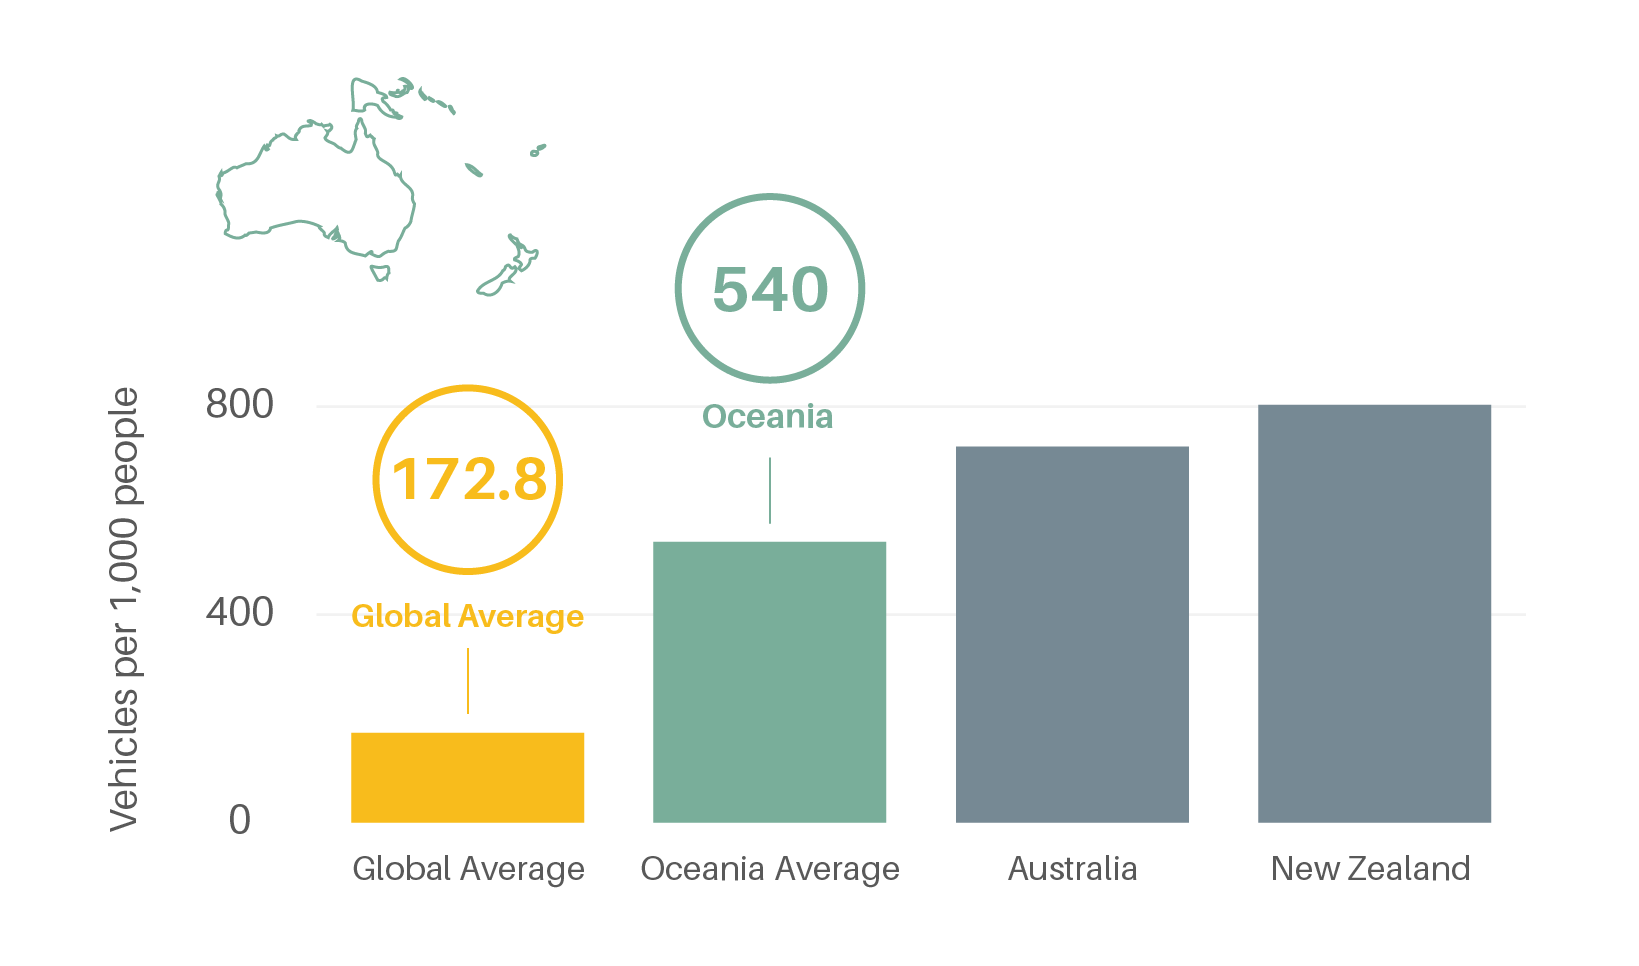
Figure 2.
Growth in car ownership in Oceania, 2005-2015
Between 2005 and 2015, passenger cars accounted for roughly two-thirds of passenger transport activity in the region, while bus and rail accounted for less than 10%. During this period, road freight activity increased 25%, while rail freight activity more than doubled, and coastal shipping fell 10%.
Electric vehicle uptake has progressed unevenly across Oceania, with the market share of the vehicles lagging behind peer countries and regions.
For shipping, container port activity fell 2.2% in Oceania in 2019 due to a slowdown in the Australian economy and declining consumer confidence.
-
Emission Trends
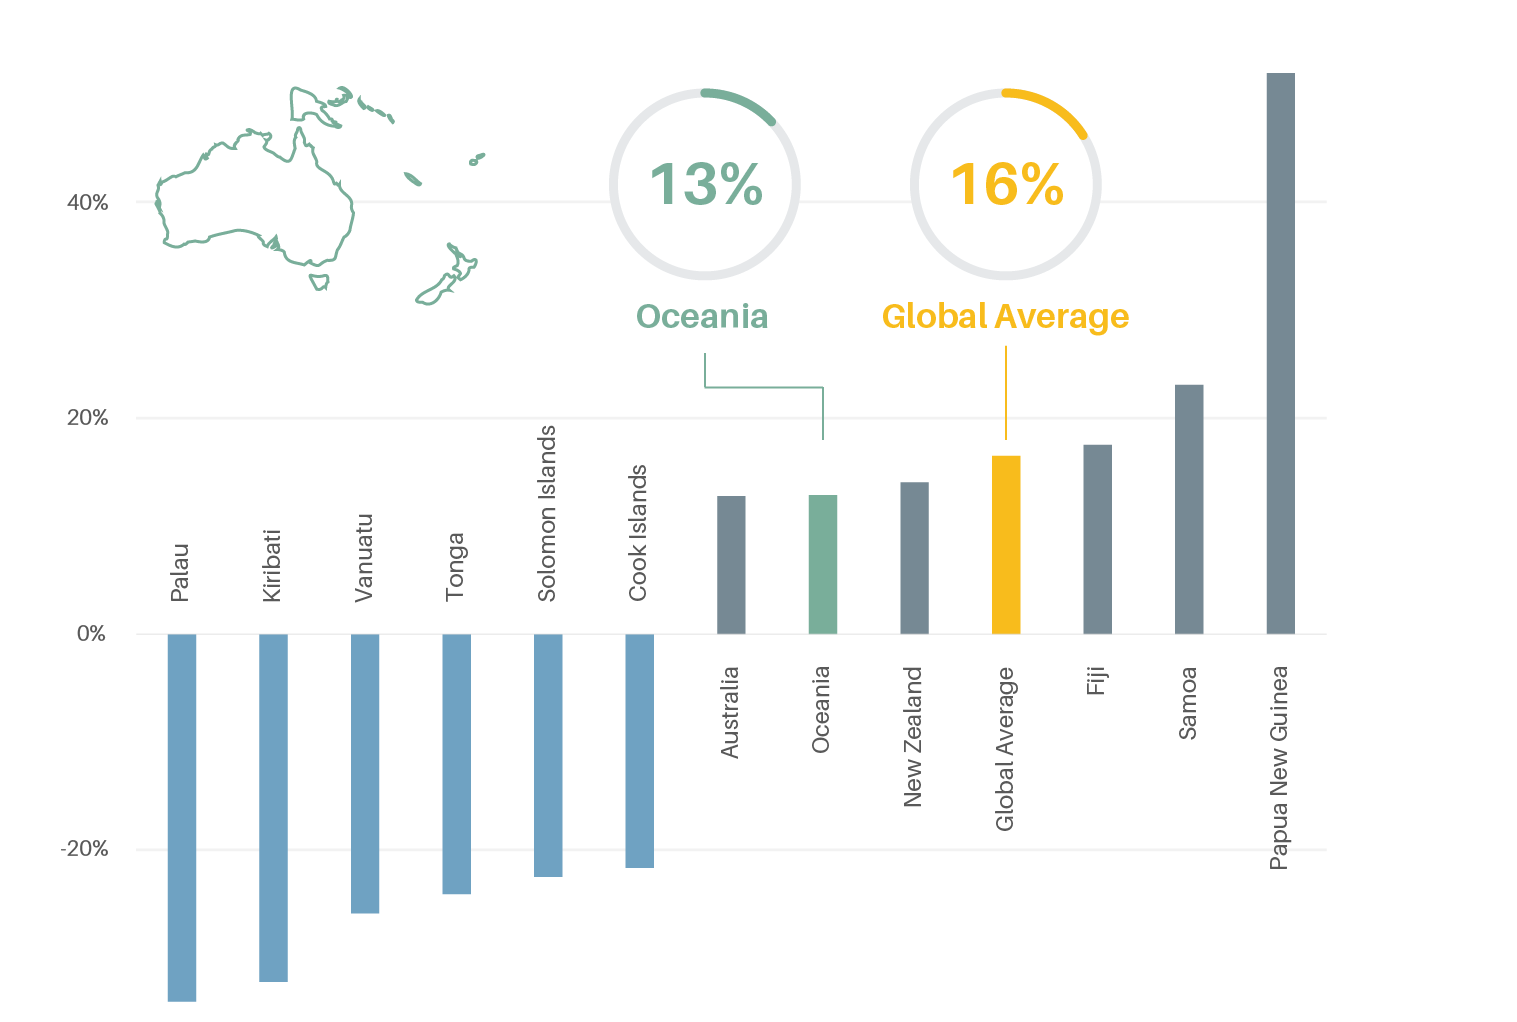
Transport carbon dioxide (CO2) emissions grew strongly in Oceania in 2019, but overall the region contributes just 2% of global transport emissions.
Countries in the region showed large variations in transport CO2 emission trends, with several recording significant increases and others significant reductions.
Figure 3.
Per capita transport CO2 emissions in Oceania, 2019
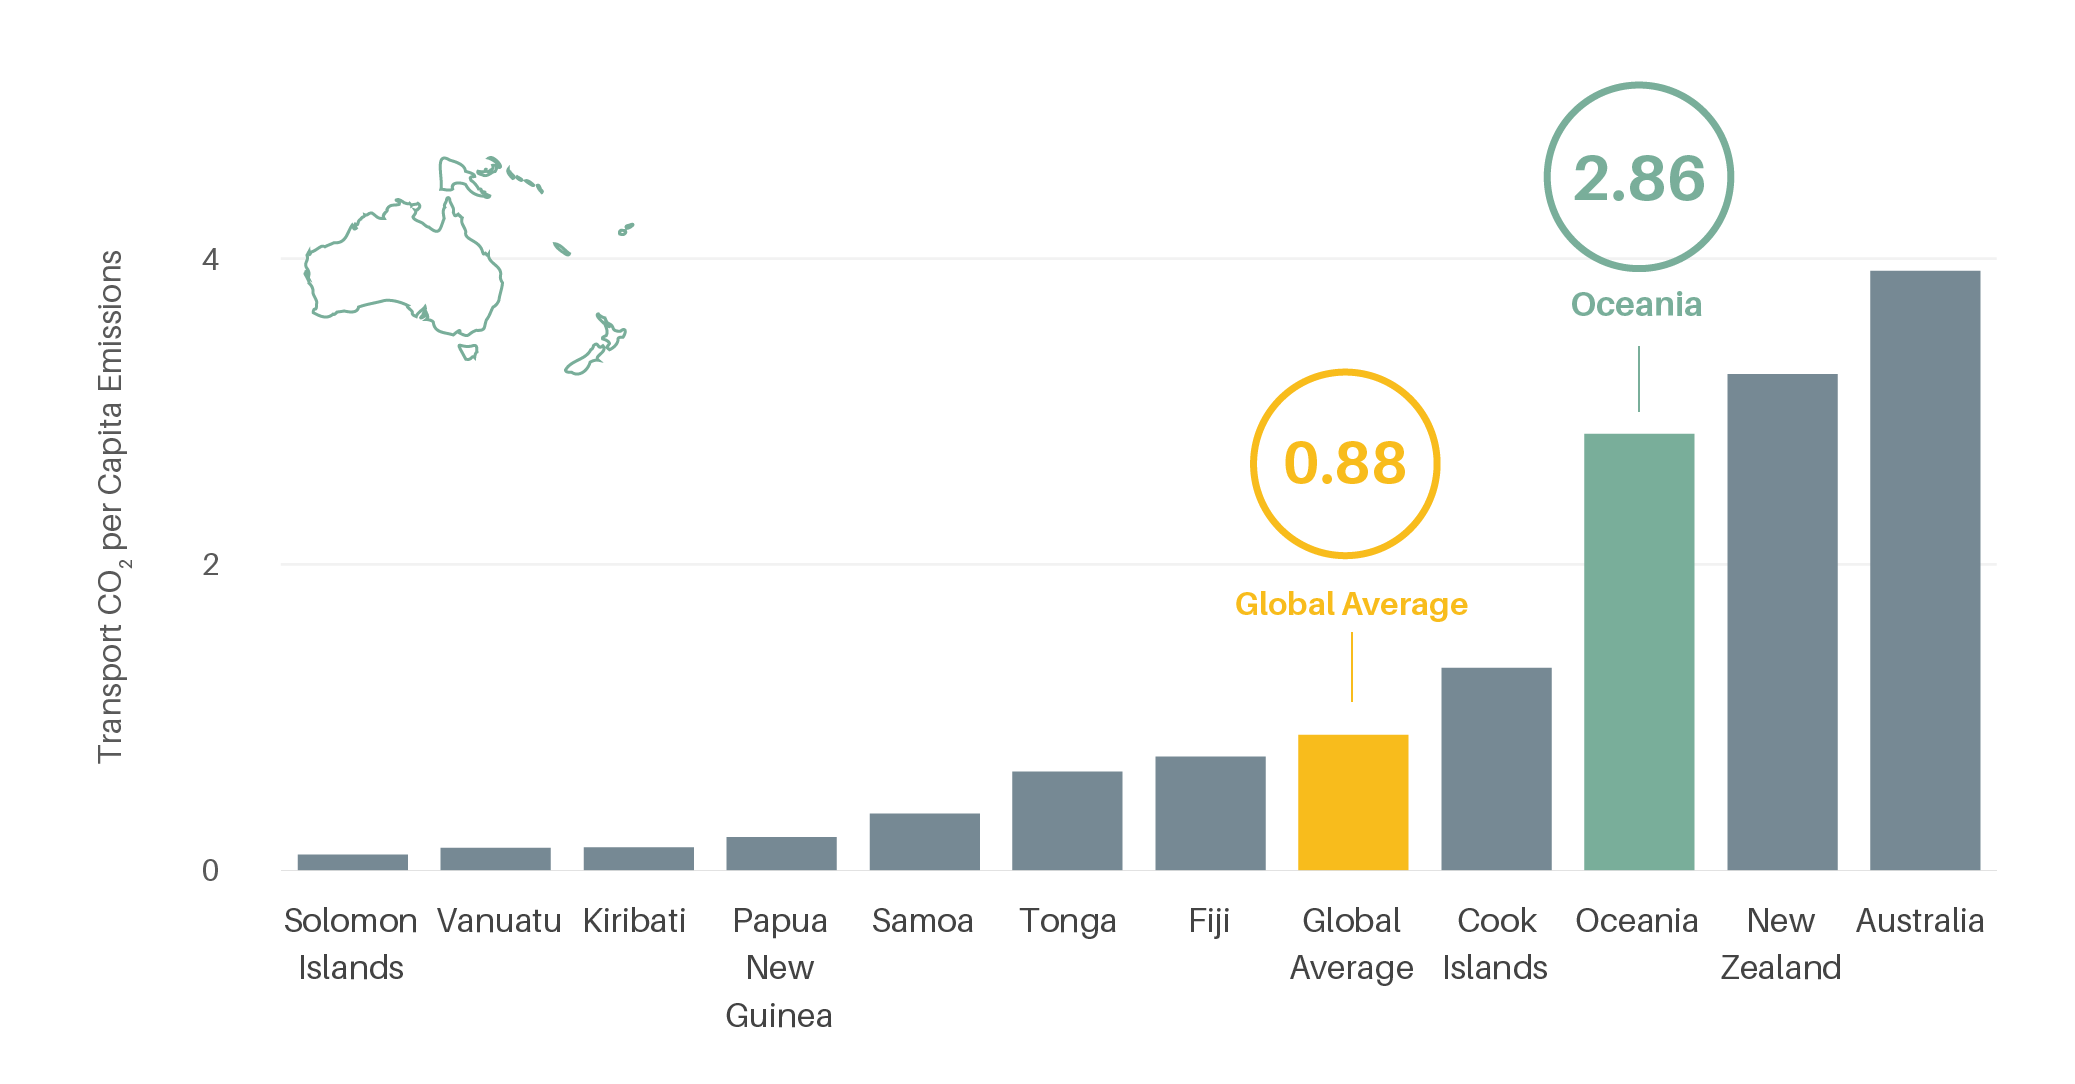
Figure 4.
Change in transport CO2 emissions in Oceania, 2010-2019
Currently 75% of the fossil fuels imported into the Pacific region are for land and maritime transport, underscoring challenges to decarbonising these sub-sectors.
-
Policy Measures
Major cities in the Oceania region are prioritising renewed investments in urban transport systems.
Adaption and resilience measures are increasingly important for transport planning and policy making due to the region’s climate vulnerabilities, which range from extreme heat, flooding and high winds in Australia to sea-level rise in small island developing states (SIDS) and other countries.
Some countries have set ambitious decarbonisation targets in their Long-Term Strategies and Nationally Determined Contributions to implement the Paris Agreement, while other plans remain insufficient.
In 2019, energy and transport ministers from the Pacific region committed to boosting renewable energy use and decreasing reliance on fossil fuels.
Six SIDS established the Pacific Blue Shipping Partnership in 2019, setting targets to reduce emissions from shipping 40% by 2030 and to reach full decarbonisation by 2050.
New walking and cycling measures were adopted and implemented in the region as non-motorised transport activities increased; for example, cycling activity in Auckland, New Zealand grew 8.9% in 2019.
-
Impacts of the COVID-19 pandemic
In April 2020, Australia reported an 80% decline in daily usage of public transport compared to January of that year.
Container shipping in the region was hit hard as demand dropped more than 10% in the first half of 2020 due to the pandemic, a sharper decline than in many global regions.
