-
Integrated transport planning
- Key Findings
Demand trends
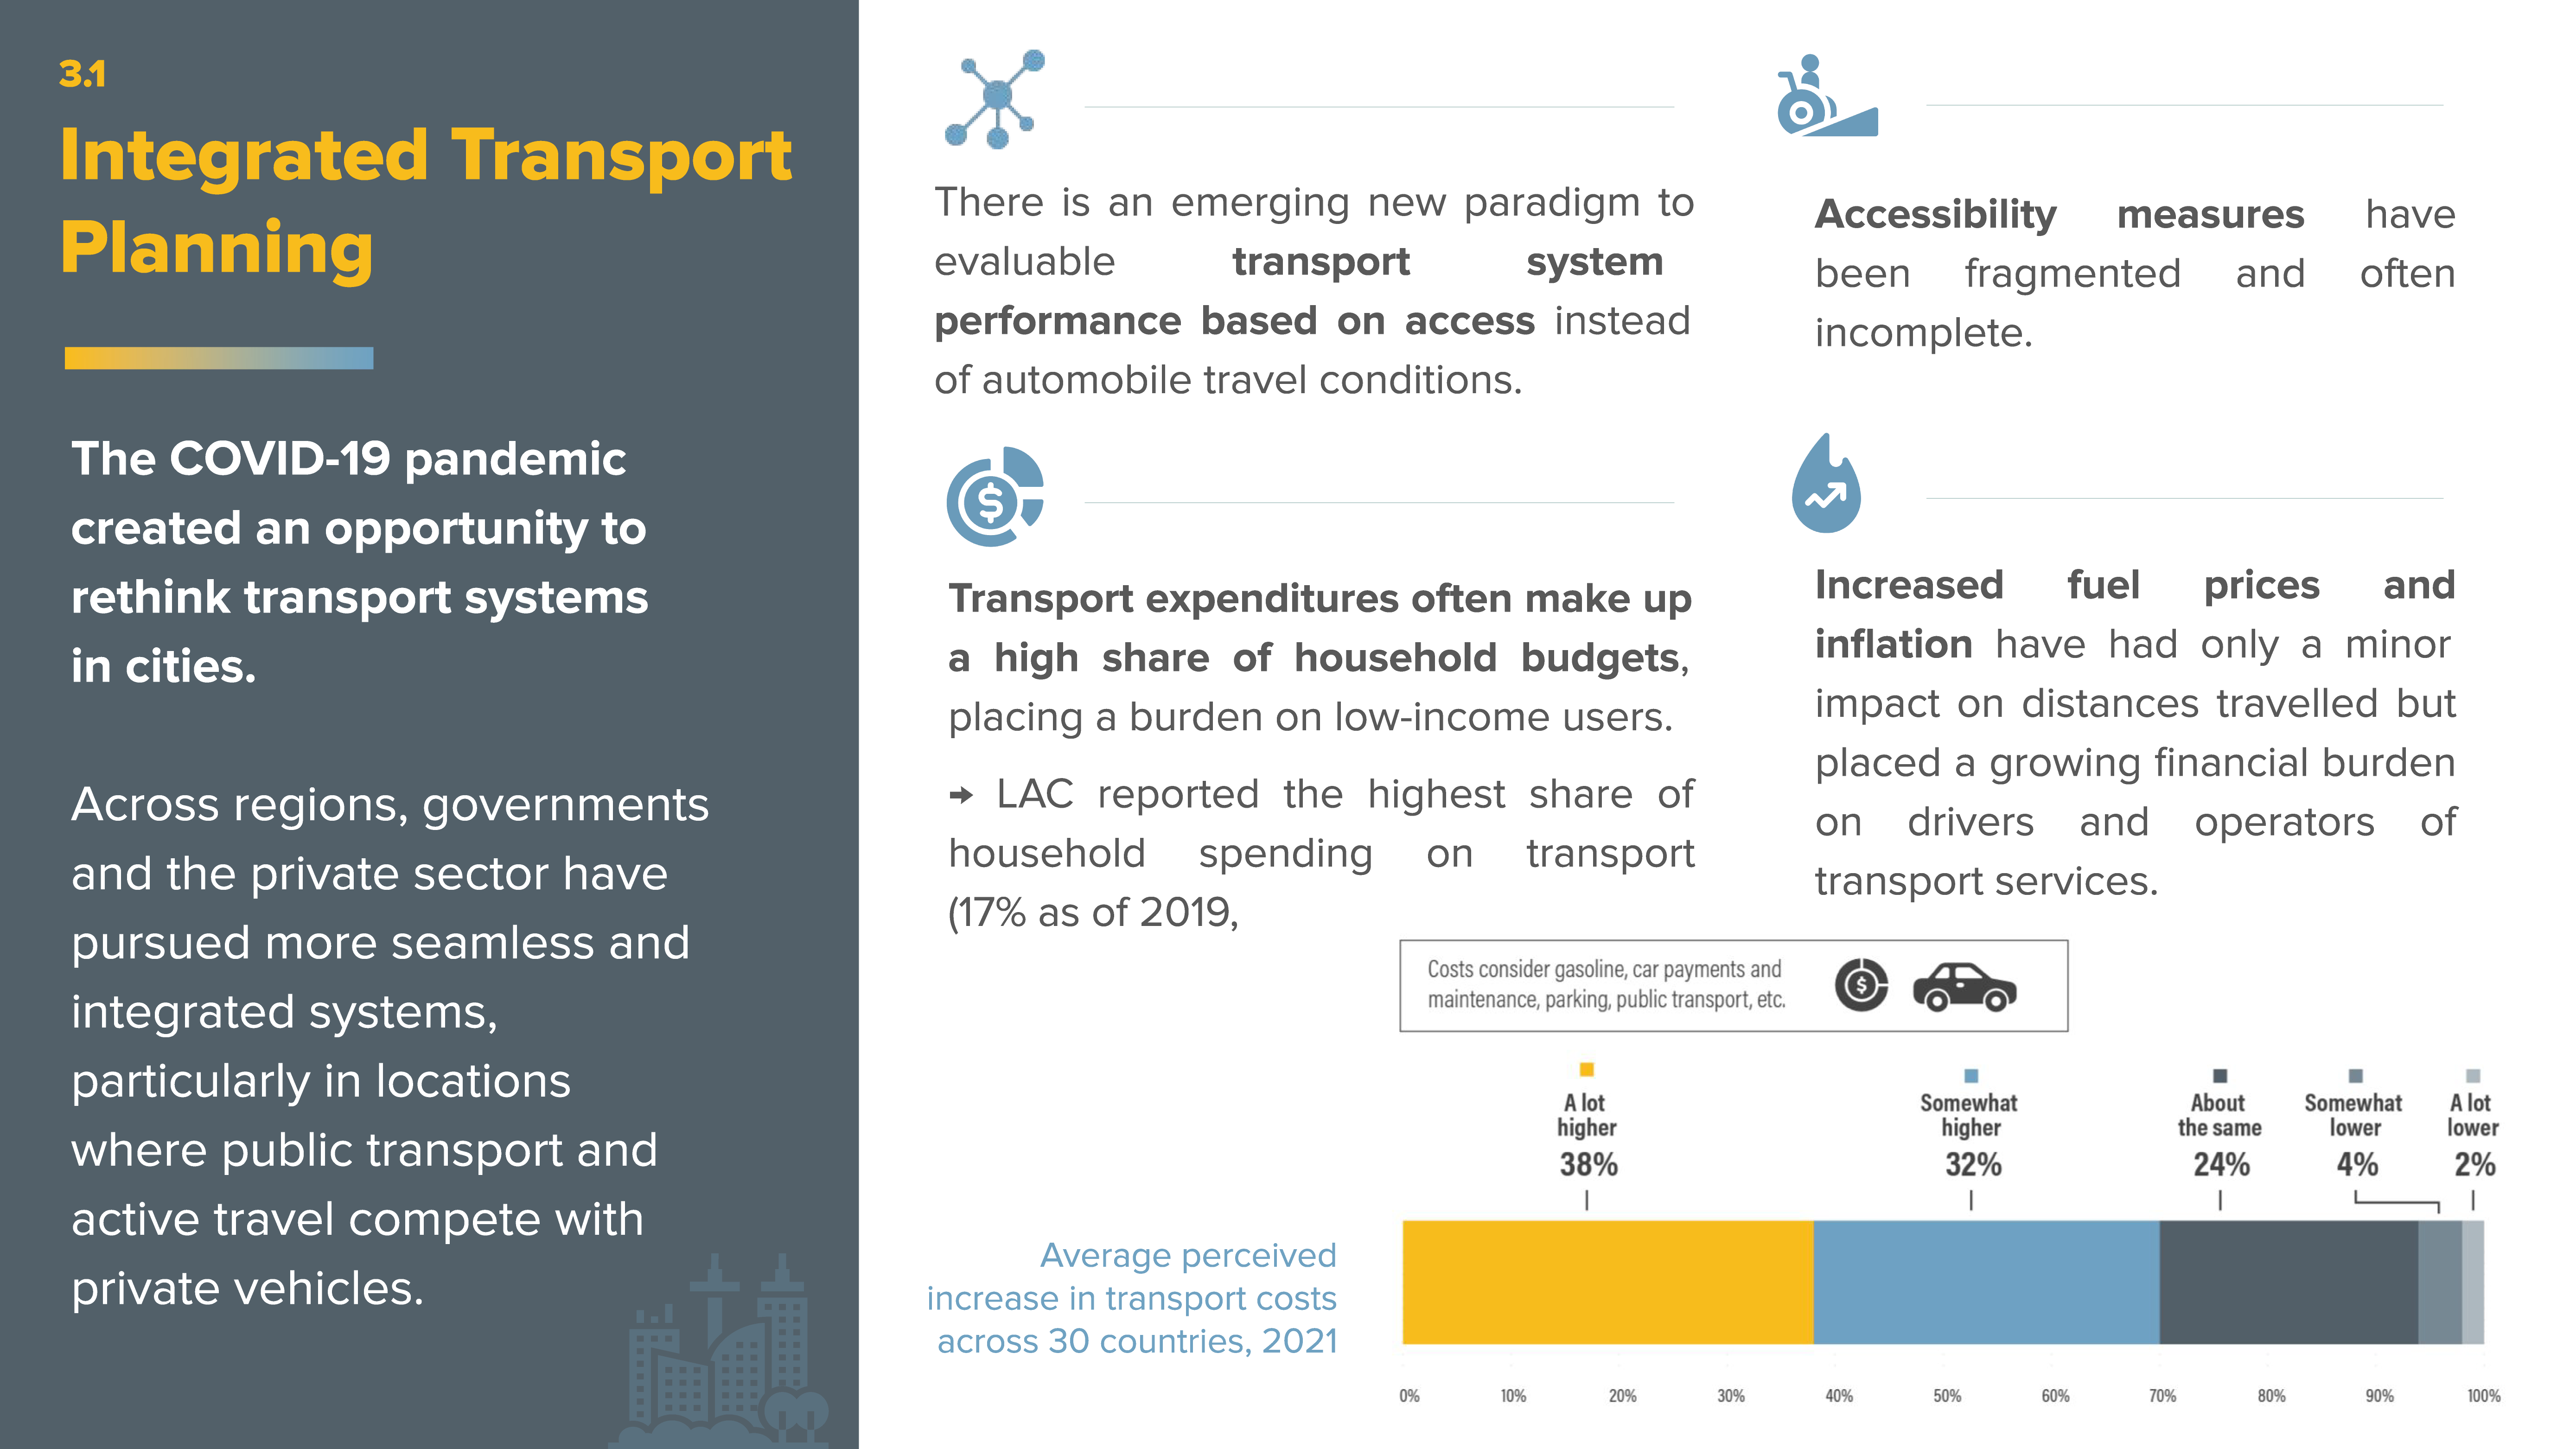
- While transport system performance has historically been evaluated based on automobile travel conditions, a new paradigm is emerging that is based on access – or people’s ability to reach goods, services and activities.
- The shares of passenger transport modes vary depending on location. Some cities have prioritised more sustainable modes through a variety of measures and investment.
- With the onset of the COVID-19 pandemic, public transport ridership fell sharply, while the use of other transport modes increased, as did working from home.
- The modal split for freight transport was not as affected during the pandemic, although this varied by location. Cargo bikes are increasingly seen as a more sustainable alternative for delivery vans in many cities.
- Pandemic-related mobility restrictions and higher fuel prices following the Russian Federation’s invasion of Ukraine contributed to changes in travel behaviour during 2020-2022, particularly teleworking and ride-hailing.
- Time spent commuting each day can reveal the degree of efficiency within a transport system, encompassing distances, connectivity, reliability and availability of transport options. Average commute times vary highly between and within countries.
- By 2021, traffic congestion had returned to pre-pandemic levels in many cities, although globally it was still 10% lower than in 2019, with peak-hour traffic also declining.
- The implementation of accessibility measures has been fragmented and often incomplete. Such measures include inclusive accessibility to public transport for diverse users, such as the elderly and people with disabilities or difficulties and other special needs. People of different genders often have different transport needs and face varying concerns and constraints, which are often heightened in low- and middle-income countries.
- In a 2021 index analysing major cities around the world, London, Madrid, and Paris were ranked the top cities for transport availability. The top cities for improving transport availability between 2018 and 2021 were Beijing, Moscow, Madrid, Milan and Tokyo.
-
Transport expenditures often make up a high share of household budgets, and freight costs vary widely, placing a burden on low-income users in particular. Among low- and middle-income regions, Latin America and the Caribbean reported the highest share of household spending on transport, at 17% as of 2019. In parts of Africa, higher freight costs are due to the low quality of infrastructure, poor regional connectivity, and inefficient logistics, among other issues.
- Increased fuel prices and inflation in recent years have had only a minor impact on distances travelled but have placed a growing financial burden on drivers and operators of transport services.
- As of early 2023, London remained the world’s most expensive city for public transport fares, while several other cities were offering free public transport to make it more affordable and to reduce private vehicle trips.
Emission trends
- The implementation of integrated transport planning has been shown to play an important role in reducing transport emissions and minimising the use of resources.
- Due mainly to the impacts of the COVID-19 pandemic, transport experienced the greatest decline in carbon dioxide (CO2) emissions (13%) in 2020 among combustion sectors, although it also showed the strongest rebound in 2021. Estimates for 2022 indicate that CO2 emissions from ground transport (road and rail) nearly recovered to pre-pandemic levels, whereas aviation emissions (domestic and international) were still 20% below 2019 levels.
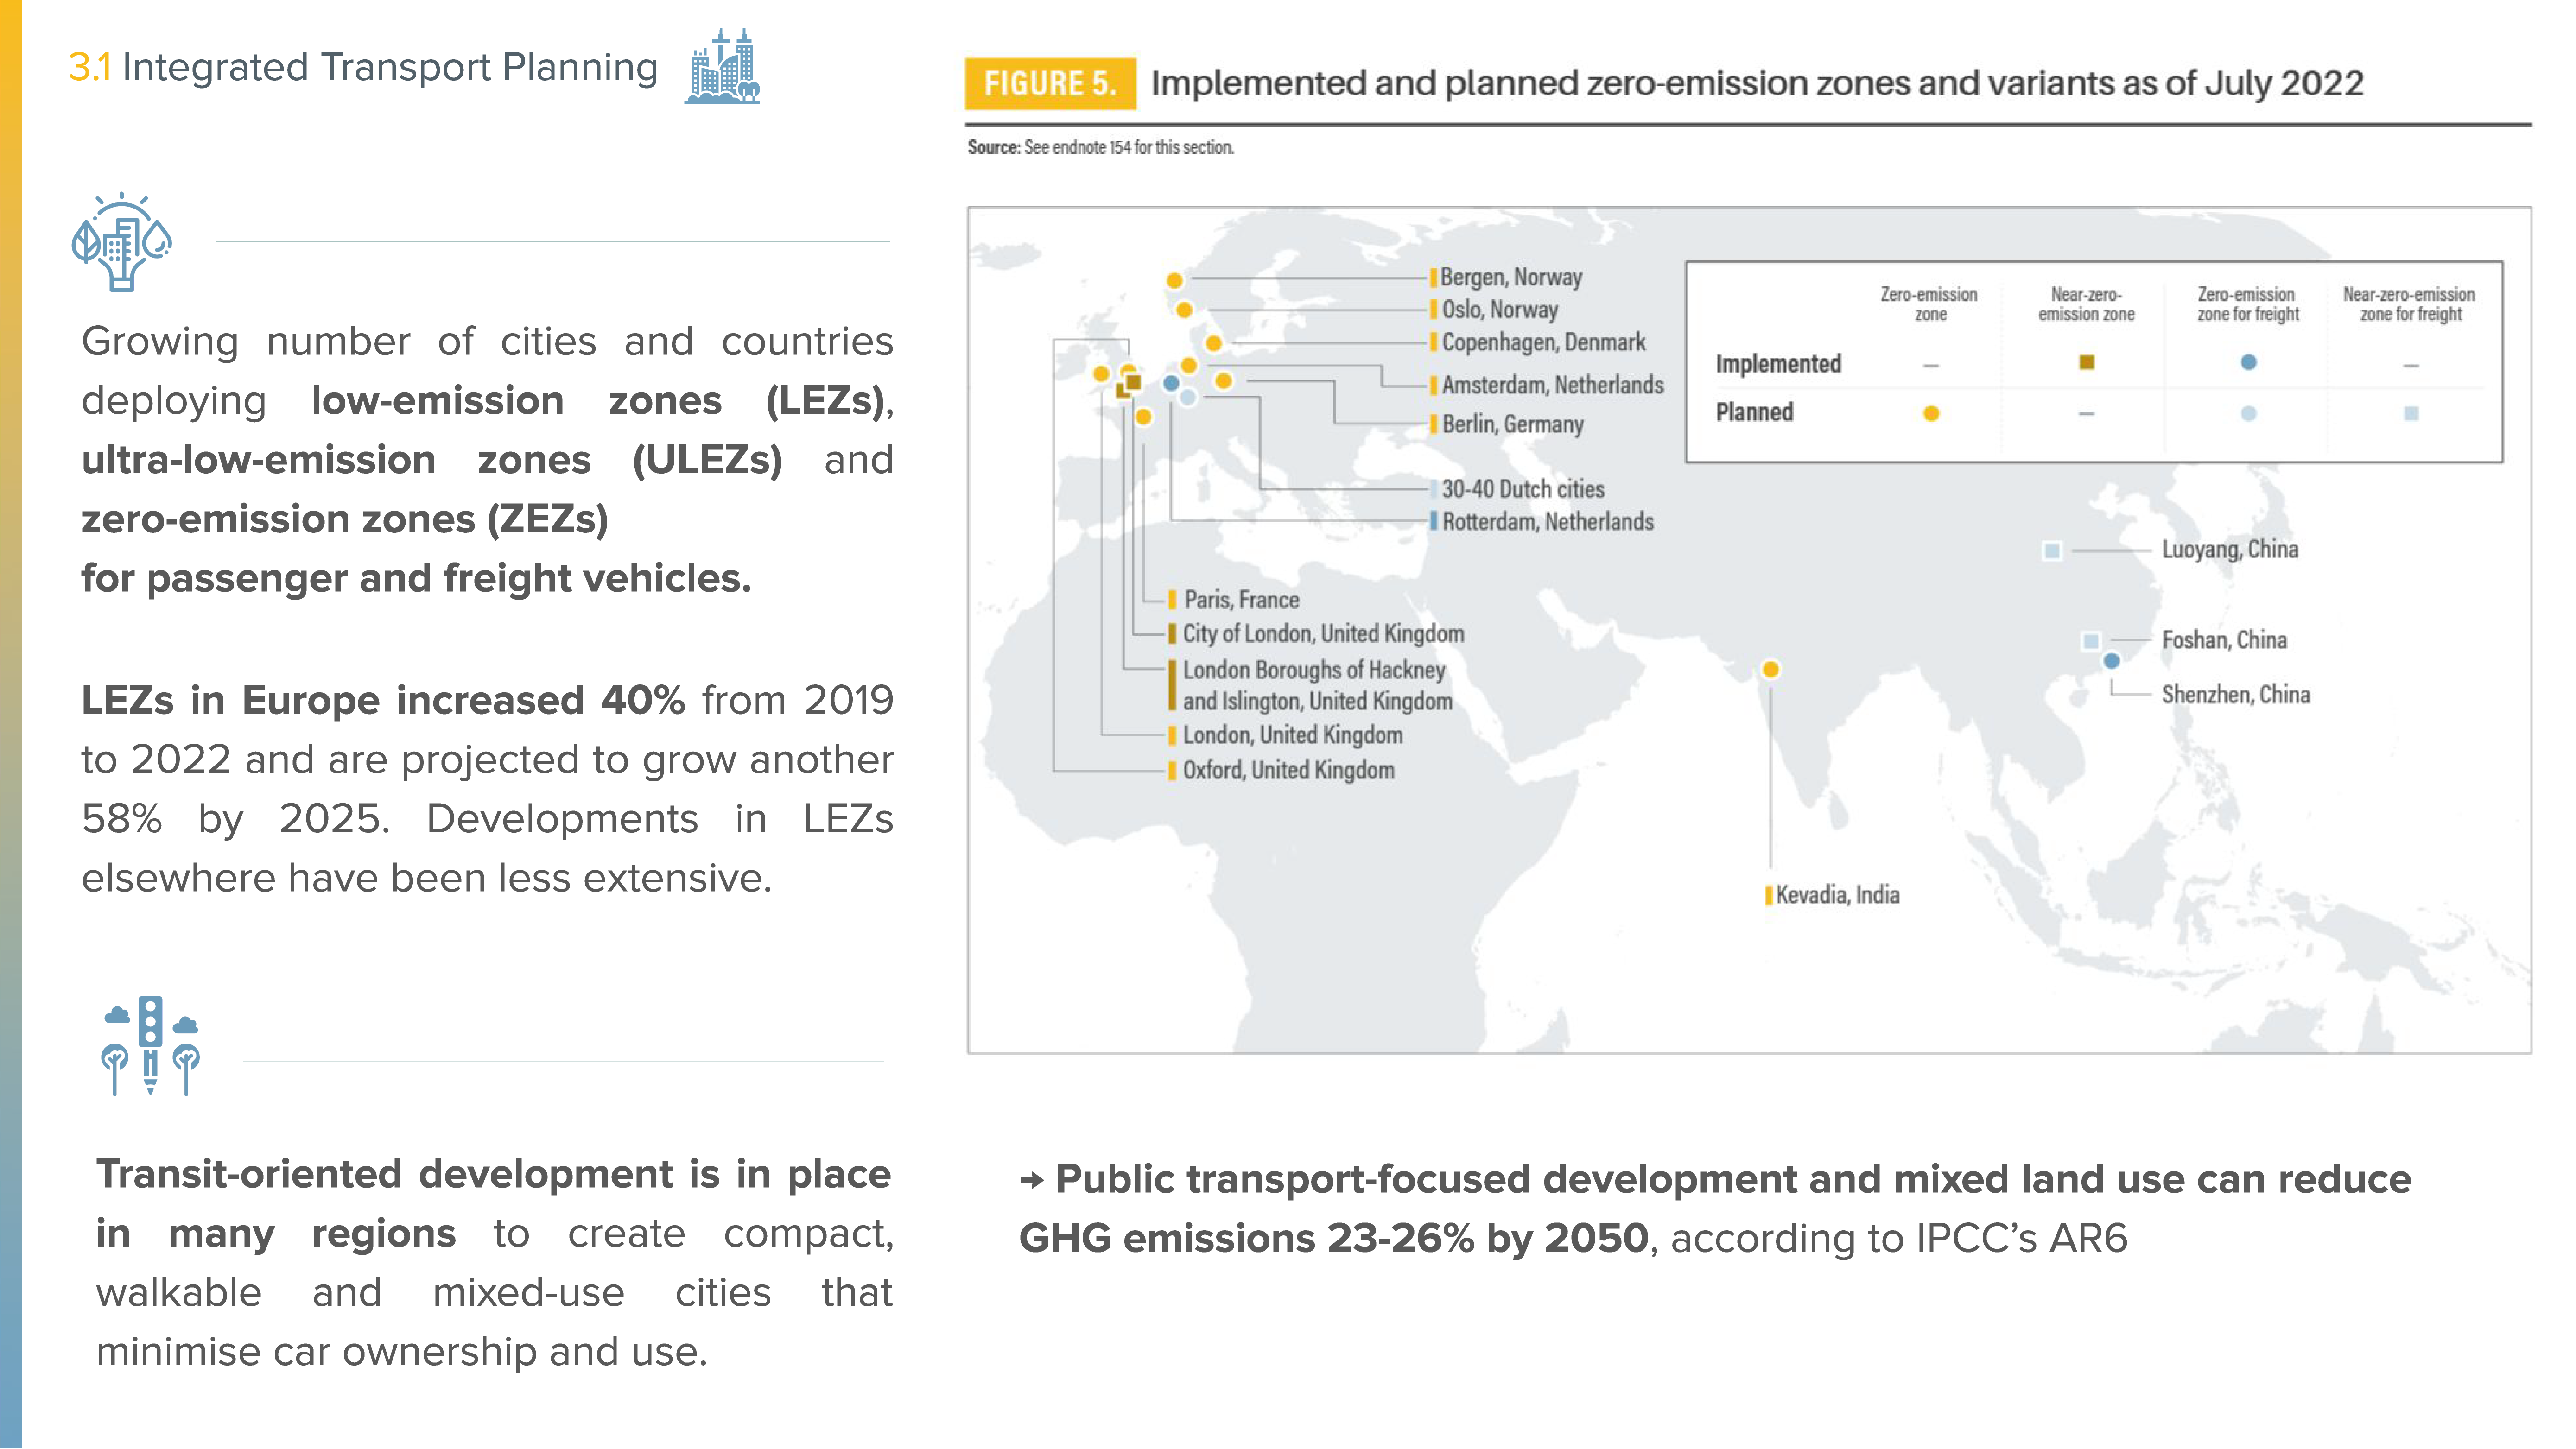
- To reduce emissions and pollution and to improve air quality, several cities and countries around the world have deployed low-emission zones (LEZs), ultra-low-emission zones (ULEZs) and zero-emission zones (ZEZs) in recent years. In some cases, these zones apply specifically to freight vehicles.
- Transit-oriented development is in place in many regions, as decision makers recognise that encouraging the use of public transport and active travel can greatly reduce transport emissions. The 2022 Sixth Assessment report from the Intergovernmental Panel on Climate Change highlighted the potential of public transport-focused development and mixed land use to reduce greenhouse gas emissions 23-26% by 2050.
Policy developments
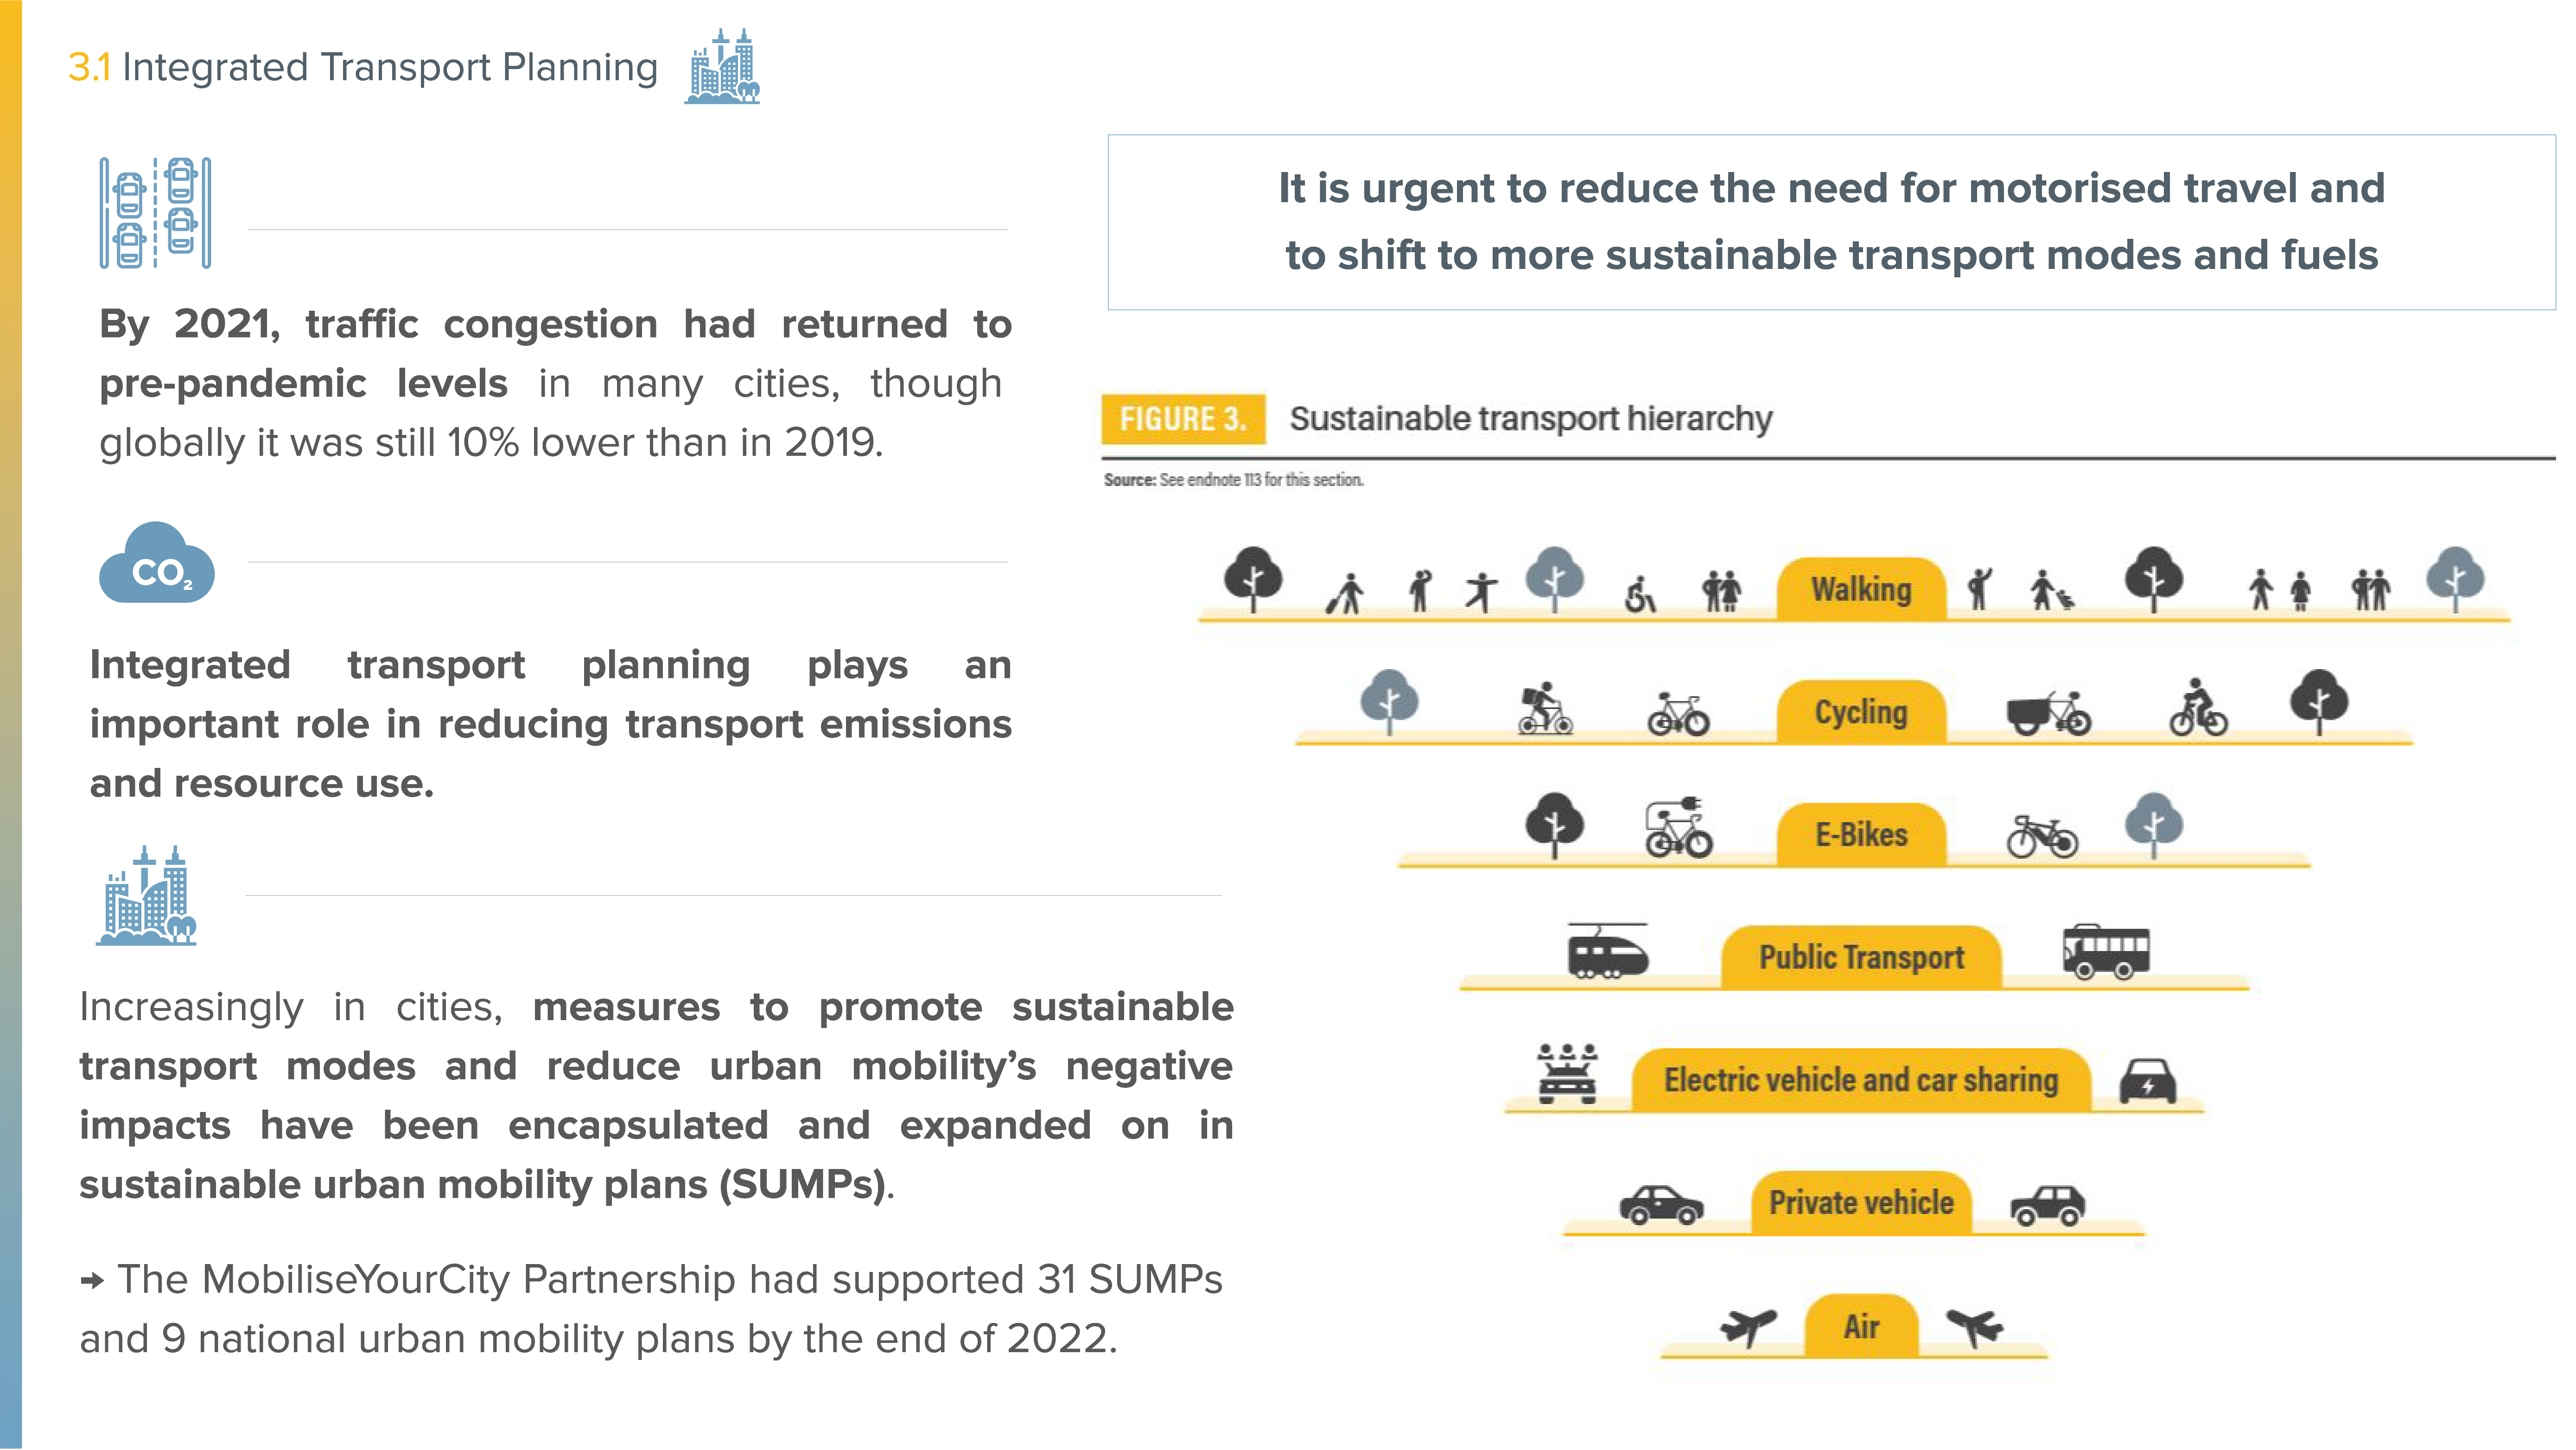
- A sustainable transport hierarchy can be helpful in integrated transport planning and policy making, as it prioritises planning and investment decisions to favour sustainable modes over expensive and resource-intensive modes that often dominate in automobile-centric models.
- Effective and cost-efficient strategies to reduce transport emissions rely on a mix of policies. In a growing number of cities, measures to promote sustainable modes of transport and to reduce the negative impacts of urban mobility have been encapsulated and expanded on in sustainable urban mobility plans (SUMPs). By the end of 2022, the MobiliseYourCity Partnership had supported the preparation of 31 SUMPs and 9 NUMPs (national urban mobility plans).
- Supporting the objectives of SUMPs, transit-oriented development has advanced through policy and funding measures in recent years. As of late 2022, the Indian cities of Chandigarh, the Pune Municipal Corporation and Navi Mumbai had successfully implemented transit-oriented development in their urban planning masterplans. The US government announced USD 13.1 million in grants in late 2022 to help cities plan for transit-oriented development.
-
Some national and sub-national governments have set vehicle travel reduction targets and in some cases require that all major transport and land-use planning decisions support these targets. Many more jurisdictions have adopted targeted bans on sales of internal combustion engine vehicles.
- The number of active LEZs in Europe increased 40% between 2019 and 2022 and is projected to grow another 58% by 2025. Developments in LEZs elsewhere have been less extensive. By mid-2021, several dozen cities had implemented or planned to implement ZEZs or near-ZEZs, mostly in Europe but also in China and India. Some cities have chosen to establish specific zero-emission zones for freight transport (ZEZ-Fs), ranging from urban delivery vans to medium- and heavy-duty trucks.
Lead Author: Hannah E. Murdock, Imperial College London
Supporting Author: Tokam Cabrel, SLOCAT Secretariat
Contributor: Todd Litman, Victoria Transport Policy Institute


